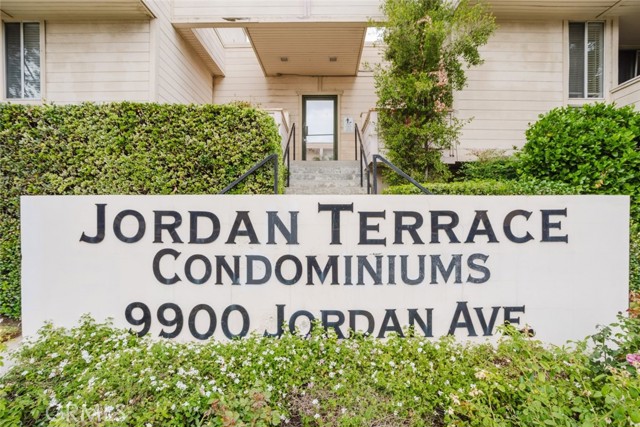
9900 Jordan Avenue, 61, Chatsworth, CA 91311
9900 Jordan Avenue, 61, Chatsworth, CA 91311
Property Description
Welcome to Jordan Terrace Condominiums! Discover this inviting 2-bedroom, 2-bathroom condo offering 900 square feet of comfortable living space in the heart of Chatsworth! Featuring a brand-new air conditioning system, this residence offers added comfort throughout the year. The thoughtfully designed layout provides a wonderful opportunity to make this space your own. Additional highlights include two community parking spaces for added convenience. The community features beautifully maintained landscaping and an inviting residential setting. Conveniently located near shopping, dining, parks, and major transportation routes, this property offers easy access to everything Chatsworth and the surrounding San Fernando Valley have to offer. Whether you're looking for a place to call home or an investment opportunity, this condo is worth exploring. Don't miss your opportunity to make it yours! Schedule your private showing today!
Features & Amenities
Property Details
Mortgage Calculator
Current Rates
Comparative Market Analysis
Affordable Tier · 5 active · 5 closed
Chatsworth · Condominium
Listed 5.3% above the median closed sale of $455,000. Price per sqft ($532) is a 23% premium to closed comps ($434).
Price Position
Positioned above the market — commands a premium.
Active Properties (5)
Active Comparables
| Address | City | Year | BD | BTH | SqFt | LotSz | LP/SqFt | LP | DIM | Score |
|---|---|---|---|---|---|---|---|---|---|---|
| 10220 De Soto | Chatsworth | 1986 | 2 | 2 | 951 | 65,332 | $447 | $424,800 | 3 | 81 |
| 10220 De Soto Avenue | Chatsworth | 1986 | 2 | 2 | 951 | 65,311 | $514 | $489,000 | 83 | 78 |
| 9960 Owensmouth Avenue | Chatsworth | 1980 | 2 | 2 | 1,313 | 63,211 | $380 | $499,000 | 43 | 75 |
| 9933 Independence | Chatsworth | 1985 | 2 | 3 | 1,096 | 50,027 | $437 | $479,000 | 39 | 75 |
| 8710 Independence ave # 202 | Canoga Park | 1983 | 2 | 2 | 1,135 | 18,583 | $392 | $445,000 | 48 | 75 |
| Total: 5 · Average | 2.0 | 2.2 | 1,089.2 | 52,492.8 | $434 | $467,360 | 43.2 | |||
| Median | 1,096 | $479,000 | ||||||||
Closed Properties (5)
Closed Comparables
| Address | City | Year | Date | BD | BTH | SqFt | LotSz | LP | SP | SP/SqFt | SP/LP | DIM | Score |
|---|---|---|---|---|---|---|---|---|---|---|---|---|---|
| 10221 Oklahoma Avenue | Chatsworth | 1986 | 08/21/2026 | 2 | 2 | 926 | 65,332 | $499,950 | $486,150 | $525 | 0.97 | 14 | 83 |
| 8575 Independence Avenue | Canoga Park | 1980 | 11/26/2025 | 2 | 2 | 987 | 41,969 | $450,000 | $455,000 | $461 | 1.01 | 84 | 69 |
| 8710 Independence Avenue | Canoga Park | 1983 | 07/30/2026 | 2 | 2 | 1,218 | 18,583 | $449,000 | $425,000 | $349 | 0.95 | 57 | 68 |
| 8565 Independence Avenue | Canoga Park | 1980 | 12/30/2025 | 2 | 2 | 987 | 0 | $424,900 | $424,900 | $430 | 1.00 | 64 | 67 |
| 10341 Canoga Avenue | Chatsworth | 1980 | 05/15/2026 | 3 | 3 | 1,361 | 143,928 | $585,000 | $550,000 | $404 | 0.94 | 95 | 63 |
| Total: 5 · Average | 2.2 | 2.2 | 1,095.8 | 67,453 | $468,210 | $468,210 | $433.8 | — | 62.8 | ||||
| Median | 987 | $455,000 | $455,000 | ||||||||||
Market Analysis
List vs Sale $/SqFt
Sale Price Trend
Days on Market
Sale vs List Price
This analysis was generated automatically from MLS data. For an in-depth, human-reviewed valuation, contact Joseph Sardella at josephsardella@gmail.com.