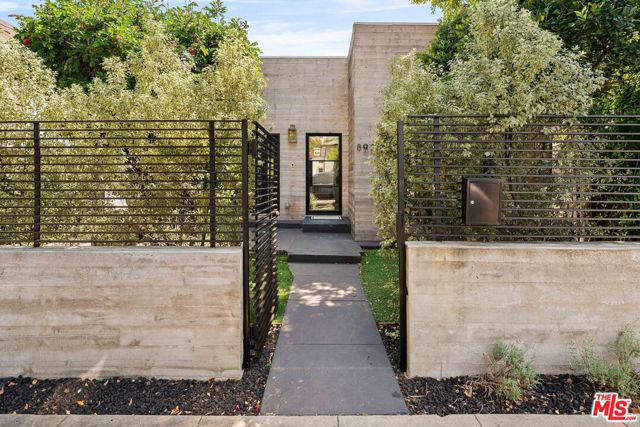
8956 Dicks Street, West Hollywood, CA 90069
8956 Dicks Street, West Hollywood, CA 90069
Property Description
Fully remodeled 3 bed 3 bath home in one of the most sought after neighborhoods, the Norma Triangle in West Hollywood. Property is gated (not pictured) and has a good size yard. A beautiful street with incredible walkability to some of the best restaurants and entertainment West Hollywood has to offer with Beverly Hills right around the corner.
Features & Amenities
Property Details
Mortgage Calculator
Current Rates
Comparative Market Analysis
Luxury Tier · 5 active · 5 closed
West Hollywood · Single Family Residence
Listed 6.4% above the median closed sale of $2,250,000. Closed comps sold at 103% of list — strong seller's market. Luxury tier — fewer comparable sales widen the confidence range.
Price Position
Positioned above the market — commands a premium.
Active Properties (5)
Active Comparables
| Address | City | Year | BD | BTH | SqFt | LotSz | LP/SqFt | LP | DIM | Score |
|---|---|---|---|---|---|---|---|---|---|---|
| 9012 Dicks Street | West Hollywood | 1923 | 3 | 4 | 1,470 | 3,200 | $1,599 | $2.35M | 54 | 95 |
| 923 Hilldale Avenue | West Hollywood | 2025 | 2 | 3 | 2,555 | 2,555 | $1,055 | $2.69M | 58 | 86 |
| 9051 Dicks Street | West Hollywood | 1928 | 5 | 4 | 2,350 | 3,219 | $1,020 | $2.40M | 95 | 80 |
| 8817 Ashcroft Avenue | West Hollywood | 1925 | 2 | 3 | 1,768 | 4,066 | $1,524 | $2.69M | 228 | 72 |
| 8818 Rosewood Avenue | West Hollywood | 1925 | 5 | 3 | 2,109 | 4,001 | $1,280 | $2.70M | 102 | 70 |
| Total: 5 · Average | 3.4 | 3.4 | 2,050.4 | 3,408.2 | $1,295.6 | $2.57M | 107.4 | |||
| Median | 2,109 | $2.69M | ||||||||
Closed Properties (5)
Closed Comparables
| Address | City | Year | Date | BD | BTH | SqFt | LotSz | LP | SP | SP/SqFt | SP/LP | DIM | Score |
|---|---|---|---|---|---|---|---|---|---|---|---|---|---|
| 8980 Lloyd Place | West Hollywood | 1925 | 07/16/2026 | 2 | 2 | 1,500 | 3,906 | $2.38M | $2.25M | $1,500 | 0.94 | 58 | 78 |
| 9031 Elevado Street | West Hollywood | 1927 | 06/16/2026 | 4 | 4 | 1,858 | 4,524 | $2.00M | $2.35M | $1,264 | 1.18 | 77 | 72 |
| 8727 Bonner Drive | Los Angeles | 1926 | 10/15/2026 | 4 | 3 | 1,944 | 4,595 | $2.19M | $2.17M | $1,119 | 0.99 | 36 | 68 |
| 428 Norwich Drive | West Hollywood | 1931 | 10/30/2026 | 4 | 3 | 1,996 | 4,796 | $2.30M | $2.38M | $1,190 | 1.03 | 50 | 67 |
| 431 Westmount Drive | West Hollywood | 1927 | 10/14/2026 | 2 | 2 | 0 | 4,777 | $2.20M | $2.20M | $0 | 1.00 | 0 | 63 |
| Total: 5 · Average | 3.2 | 2.8 | 1,824.5 | 4,519.6 | $2.27M | $2.27M | $1,268.25 | — | 44.2 | ||||
| Median | 1,944 | $2.25M | $2.25M | ||||||||||
Market Analysis
List vs Sale $/SqFt
Sale Price Trend
Days on Market
Sale vs List Price
This analysis was generated automatically from MLS data. For an in-depth, human-reviewed valuation, contact Joseph Sardella at josephsardella@gmail.com.