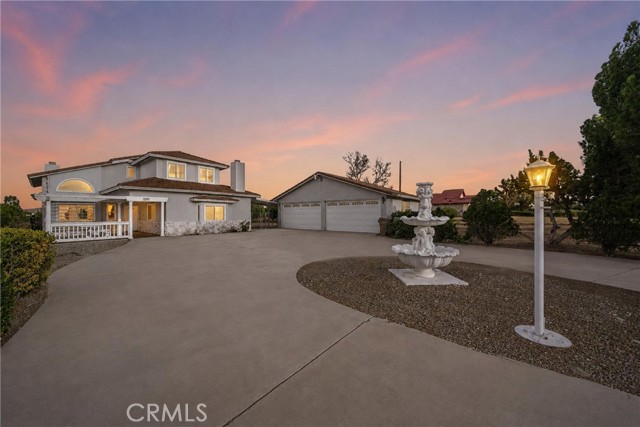
8609 Maple, Hesperia, CA 92345
8609 Maple, Hesperia, CA 92345
Property Description
Great news for buyers! The price has been reduced! Don’t miss this opportunity! This home offers an impressive combination of space, privacy, and versatility. Situated on 2.43 acres, the home features 3,120 square feet of living space, 4 spacious bedrooms, 3 bathrooms, and three fireplaces that add warmth and character throughout. A standout feature is the spacious detached 4-car garage, providing plenty of room for multiple vehicles, additional storage, or hobby space. With expansive outdoor areas and the freedom that comes with acreage, this property offers a wonderful opportunity to enjoy space, comfort, and privacy. Conveniently located near schools, shopping, dining, and commuter routes, the property provides easy access to everyday amenities while maintaining the open space and relaxed atmosphere that makes High Desert living so desirable.
Features & Amenities
Property Details
Mortgage Calculator
Current Rates
Comparative Market Analysis
Luxury Tier · 5 active · 5 closed
Hesperia · Single Family Residence
Listed in line with the median closed sale of $585,656. Price per sqft ($192) is a 14% discount to closed comps ($223). Expect a longer timeline — comps averaged 152 days on market. Luxury tier — fewer comparable sales widen the confidence range.
Price Position
Aligned with the market — fair pricing for the comps.
Active Properties (5)
Active Comparables
| Address | City | Year | BD | BTH | SqFt | LotSz | LP/SqFt | LP | DIM | Score |
|---|---|---|---|---|---|---|---|---|---|---|
| 14555 Arthur | Oak Hills | 2005 | 4 | 3 | 2,469 | 10,641 | $222 | $548,000 | 17 | 75 |
| 14353 Lonesome Dove Court | Hesperia | 2005 | 3 | 3 | 2,234 | 7,200 | $237 | $529,000 | 13 | 71 |
| 8844 Glencliff Avenue | Hesperia | 2025 | 4 | 3 | 3,110 | 7,732 | $198 | $615,000 | 135 | 68 |
| 14335 Plymouth Street | Hesperia | 2022 | 4 | 3 | 3,125 | 7,280 | $181 | $567,000 | 48 | 64 |
| 14134 Hartford Street | Hesperia | 2025 | 4 | 3 | 3,110 | 7,198 | $193 | $599,990 | 326 | 61 |
| Total: 5 · Average | 3.8 | 3.0 | 2,809.6 | 8,010.2 | $206.2 | $571,798 | 107.8 | |||
| Median | 3,110 | $567,000 | ||||||||
Closed Properties (5)
Closed Comparables
| Address | City | Year | Date | BD | BTH | SqFt | LotSz | LP | SP | SP/SqFt | SP/LP | DIM | Score |
|---|---|---|---|---|---|---|---|---|---|---|---|---|---|
| 8698 Oakwood Avenue | Hesperia | 2025 | 01/02/2026 | 4 | 3 | 2,680 | 118,483 | $714,999 | $675,000 | $252 | 0.94 | 161 | 75 |
| 14490 Arthur Street | Oak Hills | 2005 | 09/08/2026 | 4 | 3 | 2,469 | 9,287 | $535,000 | $543,000 | $220 | 1.01 | 63 | 74 |
| 14435 Arthur | Oak Hills | 2005 | 08/03/2026 | 4 | 3 | 2,469 | 9,177 | $540,000 | $550,000 | $223 | 1.02 | 48 | 67 |
| 14194 Hartford Street | Hesperia | 2025 | 04/30/2026 | 4 | 3 | 3,110 | 8,677 | $618,879 | $618,897 | $199 | 1.00 | 164 | 62 |
| 14122 Hartford Street | Hesperia | 2025 | 07/31/2026 | 4 | 3 | 2,650 | 11,525 | $585,153 | $585,656 | $221 | 1.00 | 326 | 60 |
| Total: 5 · Average | 4.0 | 3.0 | 2,675.6 | 31,429.8 | $594,510.6 | $594,510.6 | $223 | — | 152.4 | ||||
| Median | 2,650 | $585,656 | $585,656 | ||||||||||
Market Analysis
List vs Sale $/SqFt
Sale Price Trend
Days on Market
Sale vs List Price
This analysis was generated automatically from MLS data. For an in-depth, human-reviewed valuation, contact Joseph Sardella at josephsardella@gmail.com.