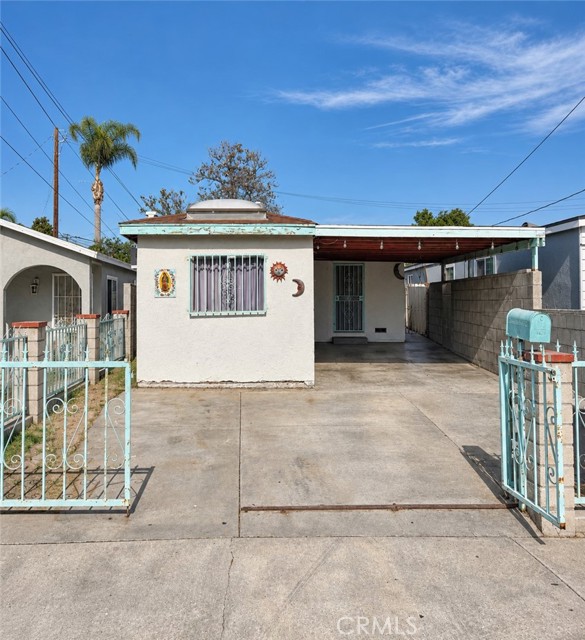
8217 Howe, Paramount, CA 90723
8217 Howe, Paramount, CA 90723
Property Description
A place to make your own ! This single-story, two-bedroom home in Paramount features a gated entry, fenced front patio, and covered parking area. Full of potential, this home offers an opportunity to bring your personal style and update it to suit your needs. Enjoy a convenient location near shopping, dining, parks, and neighboring Downey, with access to the 105, 710, and 91 freeways. Whether you’re purchasing your first home or looking for your next project, come explore the possibilities at 8217 Howe Street.
Features & Amenities
Property Details
Mortgage Calculator
Current Rates
Comparative Market Analysis
Affordable Tier · 5 active · 5 closed
Paramount · Single Family Residence
Listed 5.8% below the median closed sale of $600,000. Closed comps sold at 103% of list — strong seller's market.
Price Position
Priced below the market — value advantage over the field.
Active Properties (5)
Active Comparables
| Address | City | Year | BD | BTH | SqFt | LotSz | LP/SqFt | LP | DIM | Score |
|---|---|---|---|---|---|---|---|---|---|---|
| 13947 Downey | Paramount | 1954 | 2 | 1 | 862 | 2,958 | $751 | $647,000 | 5 | 93 |
| 8211 Wilbarn | Paramount | 1968 | 2 | 1 | 836 | 2,082 | $700 | $585,000 | 102 | 92 |
| 14517 White | Compton | 1940 | 2 | 1 | 731 | 6,662 | $847 | $619,000 | 18 | 67 |
| 602 72nd | Long Beach | 1946 | 2 | 1 | 700 | 4,957 | $857 | $599,900 | 11 | 67 |
| 1203 CASTLEGATE Avenue | Compton | 1950 | 2 | 1 | 1,010 | 5,232 | $624 | $630,000 | 87 | 61 |
| Total: 5 · Average | 2.0 | 1.0 | 827.8 | 4,378.2 | $755.8 | $616,180 | 44.6 | |||
| Median | 836 | $619,000 | ||||||||
Closed Properties (5)
Closed Comparables
| Address | City | Year | Date | BD | BTH | SqFt | LotSz | LP | SP | SP/SqFt | SP/LP | DIM | Score |
|---|---|---|---|---|---|---|---|---|---|---|---|---|---|
| 13344 Grant | Downey | 1956 | 11/09/2026 | 2 | 2 | 773 | 2,359 | $499,888 | $600,000 | $776 | 1.20 | 60 | 90 |
| 13942 Anderson | Paramount | 1952 | 07/21/2026 | 3 | 1 | 876 | 3,275 | $680,000 | $615,000 | $702 | 0.90 | 182 | 89 |
| 8340 Quimby | Paramount | 1954 | 05/27/2026 | 2 | 1 | 652 | 3,045 | $550,000 | $600,000 | $920 | 1.09 | 65 | 88 |
| 13317 Bixler | Downey | 1956 | 04/22/2026 | 2 | 1 | 773 | 2,182 | $599,000 | $560,000 | $724 | 0.94 | 43 | 87 |
| 8215 Elburg Street | Paramount | 1955 | 08/06/2026 | 3 | 1 | 1,060 | 2,157 | $610,000 | $618,000 | $583 | 1.01 | 89 | 86 |
| Total: 5 · Average | 2.4 | 1.2 | 826.8 | 2,603.6 | $598,600 | $598,600 | $741 | — | 87.8 | ||||
| Median | 773 | $600,000 | $600,000 | ||||||||||
Market Analysis
List vs Sale $/SqFt
Sale Price Trend
Days on Market
Sale vs List Price
This analysis was generated automatically from MLS data. For an in-depth, human-reviewed valuation, contact Joseph Sardella at josephsardella@gmail.com.