1 / 17
8096 Juniper Ave, Newark, CA 94560
$1.44M3bd · 2ba · 2,856 sqft
Lot 12,705 sqft•Single Family Residence•Active•95d on market•MLS# 00-41145192
8096 Juniper Ave, Newark, CA 94560
MLS# 00-41145192•Residential•Single Family Residence
Active95 days on market
$1,435,000
3
Beds
2
Baths
2,856
Sq Ft
12,705
Lot Sq Ft
1961
Year Built
Property Description
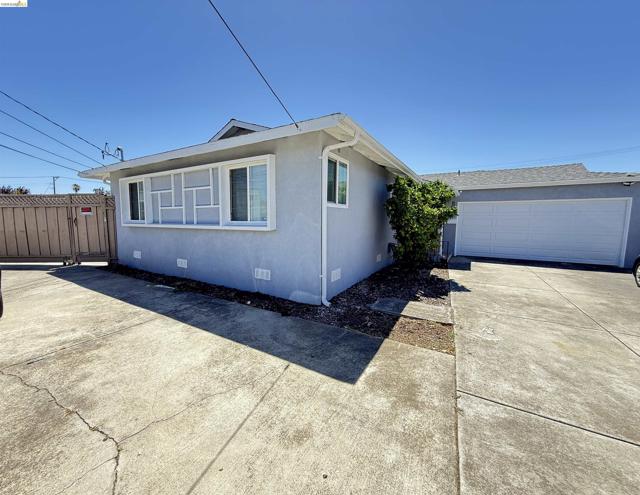
Updated Home on Spacious Corner Parcel of Over 12,000 Sq. Ft. Plus other spaces including Room in the back of the garage for possible office/workshop. a detached studio of approximately 500 Sq. Ft. with potential. Close to Fremont, Major Freeways - 880, 84, Dumbarton Bridge, Silicon Valley
Features & Amenities
FeeBuilt 1961
Property Details
Land Type
Fee
Year Built
1961
Property Type
Residential
Property Subtype
Single Family Residence
Flooring
Laminate, Tile
Roof
Shingle
City
Newark
Zip Code
94560
County
Alameda
Mortgage Calculator
Current Rates
$
$
%
Monthly Payment
$7,256.14
Principal & Interest
Loan Amount
$1,148,000
Total Interest
$1,464,211
Total Payment Over 30 Years
$2,612,211
This calculator provides estimates only. Actual mortgage payments may include taxes, insurance, HOA fees, and PMI. Contact a lender for accurate quotes.
Comparative Market Analysis
Residential Tier · 2 active · 5 closed
8096 Juniper Ave, Newark, CA 94560
Newark · Single Family Residence
$1.44M
Residential TierBeds
3
Baths
2
Sqft
2,856
Lot
12,705 sqft
Year
1961
$/Sqft
$502
Pool: No✓
Listed 3.5% above the median closed sale of $1,386,000. Price per sqft ($502) is a 41% discount to closed comps ($845). Closed comps sold at 101% of list — strong seller's market.
Price Position
Aligned with the market — fair pricing for the comps.
At market
Subject listed at $1.44M· $502/sqft
Total list price
Closed comps
vs closed median $1.39M
+$49K (+3.5%)
Active comps
vs active median $1.49M
−$53K (−3.6%)
Price per sqft
Closed compsinsufficient comp data
Active comps
vs active avg $/sqft $958
−$456 (−47.6%)
Active Properties (2)
Active Comparables
| Address | City | Year | BD | BTH | SqFt | LotSz | LP/SqFt | LP | DIM | Score |
|---|---|---|---|---|---|---|---|---|---|---|
| 37150 Alexander St | Fremont | 1960 | 3 | 2 | 1,801 | 6,050 | $826 | $1.49M | 24 | 65 |
| 36095 San Pedro DR | Fremont | 1956 | 3 | 2 | 1,148 | 15,606 | $1,089 | $1.25M | 46 | 59 |
| Total: 2 · Average | 3.0 | 2.0 | 1,474.5 | 10,828 | $957.5 | $1.37M | 35 | |||
| Median | 1,801 | $1.49M | ||||||||
Closed Properties (5)
Closed Comparables
| Address | City | Year | Date | BD | BTH | SqFt | LotSz | LP | SP | SP/SqFt | SP/LP | DIM | Score |
|---|---|---|---|---|---|---|---|---|---|---|---|---|---|
| 36340 Cypress Point Dr | Newark | 1969 | 06/23/2026 | 3 | 2 | 1,482 | 8,085 | $1.40M | $1.44M | $972 | 1.03 | 39 | 74 |
| 36571 Spruce St | Newark | 1976 | 09/23/2026 | 3 | 2 | 1,240 | 7,446 | $1.20M | $1.27M | $1,028 | 1.06 | 28 | 73 |
| 36671 Ponderosa Ct. | Newark | 1977 | 08/31/2026 | 3 | 3 | 1,953 | 7,754 | $1.40M | $1.38M | $704 | 0.98 | 66 | 73 |
| 36481 Bettencourt St | Newark | 1964 | 08/28/2026 | 4 | 2 | 1,725 | 7,566 | $1.39M | $1.39M | $803 | 1.00 | 73 | 72 |
| 7728 Hazelnut Dr | Newark | 1964 | 02/25/2026 | 4 | 2 | 2,153 | 6,000 | $1.60M | $1.55M | $720 | 0.97 | 40 | 70 |
| Total: 5 · Average | 3.4 | 2.2 | 1,710.6 | 7,370.2 | $1.41M | $1.41M | $845.4 | — | 49.2 | ||||
| Median | 1,725 | $1.39M | $1.39M | ||||||||||
Market Analysis
List vs Sale $/SqFt
Sale Price Trend
Days on Market
Sale vs List Price
AI-generated CMA
This analysis was generated automatically from MLS data. For an in-depth, human-reviewed valuation, contact Joseph Sardella at josephsardella@gmail.com.