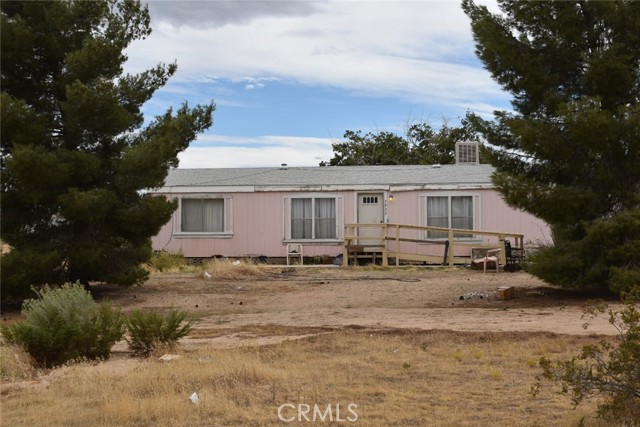
7933 7th, Phelan, CA 92371
7933 7th, Phelan, CA 92371
Property Description
Prime Flip Opportunity on 2+ Acres. This 3-bedroom, 2-bathroom manufactured home in Phelan is the blank canvas you’ve been looking for. Situated on a massive 2.04-acre lot with expansive territorial views, the value here is in the land and the footprint. The property features a substantial detached 4-car garage, offering significant utility perfect for a fix-and-flip or a long-term hold once rehabilitated. This home is ready for a full renovation to capture the growing demand in the High Desert market. High equity potential for the right crew—bring your tools and your vision. Property is being sold as-is, is a strict cash-only sale and will not last.
Features & Amenities
Property Details
Mortgage Calculator
Current Rates
Comparative Market Analysis
Affordable Tier · 2 active · 2 closed
Phelan · Manufactured On Land
Listed 12.6% above the median closed sale of $235,250.
Price Position
Positioned above the market — commands a premium.
Active Properties (2)
Active Comparables
| Address | City | Year | BD | BTH | SqFt | LotSz | LP/SqFt | LP | DIM | Score |
|---|---|---|---|---|---|---|---|---|---|---|
| 12037 Cordero | Victorville | 1987 | 2 | 2 | 868 | 79,279 | $334 | $290,000 | 53 | 68 |
| 11625 Center St | Victorville | 1989 | 2 | 2 | 924 | 96,267 | $298 | $275,000 | 123 | 58 |
| Total: 2 · Average | 2.0 | 2.0 | 896 | 87,773 | $316 | $282,500 | 88 | |||
| Median | 924 | $290,000 | ||||||||
Closed Properties (2)
Closed Comparables
| Address | City | Year | Date | BD | BTH | SqFt | LotSz | LP | SP | SP/SqFt | SP/LP | DIM | Score |
|---|---|---|---|---|---|---|---|---|---|---|---|---|---|
| 6450 Maricopa Rd | Phelan | 1988 | 10/23/2025 | 3 | 2 | 1,344 | 88,000 | $250,000 | $243,500 | $181 | 0.97 | 36 | 63 |
| 9950 Sonora Road | Phelan | 1973 | 05/27/2026 | 3 | 2 | 1,248 | 87,120 | $229,000 | $227,000 | $182 | 0.99 | 172 | 61 |
| Total: 2 · Average | 3.0 | 2.0 | 1,296 | 87,560 | $235,250 | $235,250 | $181.5 | — | 104 | ||||
| Median | 1,344 | $243,500 | $243,500 | ||||||||||
Market Analysis
List vs Sale $/SqFt
Sale Price Trend
Days on Market
Sale vs List Price
This analysis was generated automatically from MLS data. For an in-depth, human-reviewed valuation, contact Joseph Sardella at josephsardella@gmail.com.