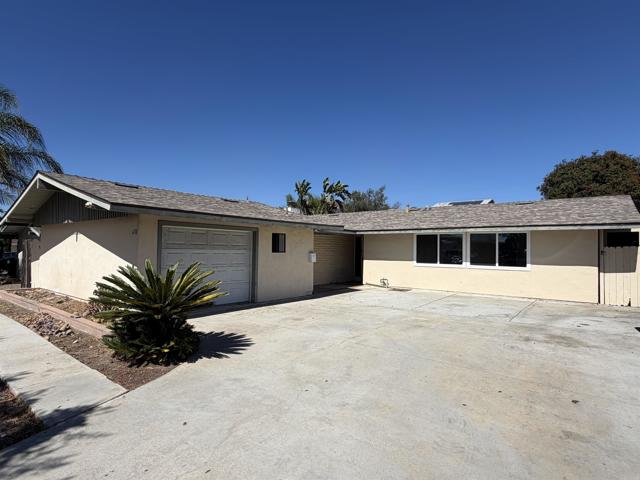
6701 Jackson Drive, San Diego, CA 92119
6701 Jackson Drive, San Diego, CA 92119
Property Description
Beautiful opportunity in the desirable San Carlos/Lake Murray area! This 5-bedroom, 3-bath home offers approximately 2,000 sq. ft. of living space on a spacious lot and presents an excellent opportunity for an owner-user, investor, or buyer looking to renovate and create their ideal home. Property is being offered in its current AS-IS condition. Seller may consider seller financing; terms subject to seller approval and negotiation. Buyer to independently verify all information, including square footage, permits, zoning, property condition, and development potential. Don't miss this opportunity!
Features & Amenities
Property Details
Mortgage Calculator
Current Rates
Comparative Market Analysis
Residential Tier · 5 active · 5 closed
San Diego · Single Family Residence
Listed 3.4% below the median closed sale of $983,000. Price per sqft ($475) is a 25% discount to closed comps ($631). Closed comps sold at 100% of list — strong seller's market.
Price Position
Aligned with the market — fair pricing for the comps.
Active Properties (5)
Active Comparables
| Address | City | Year | BD | BTH | SqFt | LotSz | LP/SqFt | LP | DIM | Score |
|---|---|---|---|---|---|---|---|---|---|---|
| 5762 Dugan Avenue | La Mesa | 1958 | 3 | 2 | 1,473 | 11,800 | $610 | $899,000 | 17 | 74 |
| 8405 Lake Ben Avenue | San Diego | 1960 | 3 | 2 | 1,140 | 6,098 | $789 | $899,999 | 25 | 74 |
| 8317 Hudson Drive | San Diego | 1961 | 3 | 2 | 1,200 | 6,000 | $792 | $950,000 | 113 | 73 |
| 6954 Ballinger | San Diego | 1963 | 3 | 2 | 1,041 | 6,500 | $864 | $899,000 | 38 | 70 |
| 7245 Decanture Cove | San Diego | 1972 | 3 | 2 | 1,304 | 7,800 | $748 | $975,000 | 48 | 66 |
| Total: 5 · Average | 3.0 | 2.0 | 1,231.6 | 7,639.6 | $760.6 | $924,599.8 | 48.2 | |||
| Median | 1,200 | $899,999 | ||||||||
Closed Properties (5)
Closed Comparables
| Address | City | Year | Date | BD | BTH | SqFt | LotSz | LP | SP | SP/SqFt | SP/LP | DIM | Score |
|---|---|---|---|---|---|---|---|---|---|---|---|---|---|
| 6732 JACKSON DR | San Diego | 1960 | 05/13/2026 | 4 | 3 | 1,979 | 8,600 | $975,000 | $965,000 | $488 | 0.99 | 28 | 93 |
| 7643 Flag Lake Street | San Diego | 1963 | 10/06/2026 | 3 | 2 | 1,778 | 8,300 | $1.05M | $1.05M | $591 | 1.00 | 0 | 85 |
| 8378 Lake Ashwood Avenue | San Diego | 1960 | 09/25/2026 | 3 | 2 | 1,490 | 9,148 | $980,000 | $983,000 | $660 | 1.00 | 37 | 81 |
| 8330 Dallas Street | La Mesa | 1953 | 09/28/2026 | 3 | 2 | 1,387 | 7,405 | $999,995 | $985,000 | $710 | 0.98 | 66 | 80 |
| 8243 Blue Lake Drive | San Diego | 1962 | 05/28/2026 | 4 | 2 | 1,275 | 10,454 | $875,000 | $900,000 | $706 | 1.03 | 27 | 79 |
| Total: 5 · Average | 3.4 | 2.2 | 1,581.8 | 8,781.4 | $976,600 | $976,600 | $631 | — | 31.6 | ||||
| Median | 1,490 | $983,000 | $983,000 | ||||||||||
Market Analysis
List vs Sale $/SqFt
Sale Price Trend
Days on Market
Sale vs List Price
This analysis was generated automatically from MLS data. For an in-depth, human-reviewed valuation, contact Joseph Sardella at josephsardella@gmail.com.