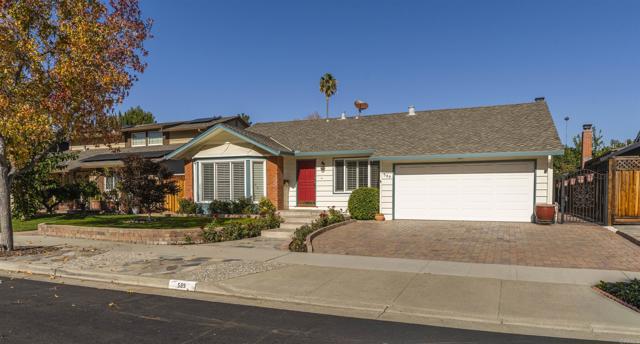
589 Elvis Drive, San Jose, CA 95123
589 Elvis Drive, San Jose, CA 95123
Property Description
Nestled in a desirable neighborhood with stunning hill views, this warm and inviting single-story home has been meticulously maintained and cherished by the same family for over 40 years. Boasting excellent curb appeal, the front yard welcomes you with manicured landscaping, artificial turf, and a pristine, oversized paver driveway that provides ample room for additional parking. Inside, the functional floor plan features 4 bedrooms, 2 full bathrooms, and beautiful hard flooring running throughout most of the home. The kitchen is equipped with timeless maple cabinetry, blending style and storage seamlessly. One of the property's standout features is the integration of beautiful, solid wood sliding doors—including an impressive double slider in the family room that floods the space with natural light. The back yard is an absolute oasis of relaxation, featuring low-maintenance artificial turf, high-end pavers, and retractable awnings that offer perfect shade for outdoor dining and unwinding. This rare gem perfectly combines long-term pride of ownership with low-maintenance living.
Features & Amenities
Property Details
Mortgage Calculator
Current Rates
Comparative Market Analysis
Residential Tier · 2 active · 5 closed
San Jose · Single Family Residence
Listed 11.7% above the median closed sale of $1,342,000. Price per sqft ($778) is a 27% discount to closed comps ($1,065). Closed comps sold at 102% of list — strong seller's market.
Price Position
Positioned above the market — commands a premium.
Active Properties (2)
Active Comparables
| Address | City | Year | BD | BTH | SqFt | LotSz | LP/SqFt | LP | DIM | Score |
|---|---|---|---|---|---|---|---|---|---|---|
| 5950 Jacques Drive | San Jose | 1971 | 3 | 2 | 1,228 | 7,500 | $1,124 | $1.38M | 145 | 70 |
| 654 Calpella Dr | San Jose | 1974 | 4 | 3 | 1,954 | 7,590 | $818 | $1.60M | 206 | 68 |
| Total: 2 · Average | 3.5 | 2.5 | 1,591 | 7,545 | $971 | $1.49M | 175.5 | |||
| Median | 1,954 | $1.60M | ||||||||
Closed Properties (5)
Closed Comparables
| Address | City | Year | Date | BD | BTH | SqFt | LotSz | LP | SP | SP/SqFt | SP/LP | DIM | Score |
|---|---|---|---|---|---|---|---|---|---|---|---|---|---|
| 408 Santa Mesa DR | San Jose | 1966 | 09/30/2026 | 3 | 2 | 1,649 | 6,099 | $1.30M | $1.33M | $810 | 1.03 | 24 | 83 |
| 450 Madison dr | San Jose | 1968 | 01/24/2026 | 3 | 2 | 1,410 | 6,000 | $1.55M | $1.53M | $1,085 | 0.99 | 27 | 83 |
| 6093 Blacklock Ct | San Jose | 1968 | 06/15/2026 | 3 | 2 | 1,143 | 5,985 | $1.30M | $1.34M | $1,174 | 1.03 | 36 | 82 |
| 6198 Hancock Ave | San Jose | 1968 | 01/16/2026 | 4 | 2 | 1,342 | 5,985 | $1.42M | $1.27M | $950 | 0.90 | 73 | 80 |
| 705 Los Huecos Dr | San Jose | 1968 | 02/05/2026 | 3 | 2 | 1,223 | 5,985 | $1.40M | $1.60M | $1,308 | 1.15 | 26 | 72 |
| Total: 5 · Average | 3.2 | 2.0 | 1,353.4 | 6,010.8 | $1.42M | $1.42M | $1,065.4 | — | 37.2 | ||||
| Median | 1,342 | $1.34M | $1.34M | ||||||||||
Market Analysis
List vs Sale $/SqFt
Sale Price Trend
Days on Market
Sale vs List Price
This analysis was generated automatically from MLS data. For an in-depth, human-reviewed valuation, contact Joseph Sardella at josephsardella@gmail.com.