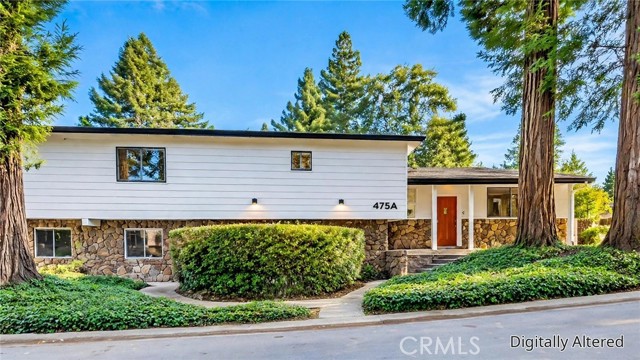
475 South Barrett Road, A, Yuba City, CA 95991
475 South Barrett Road, A, Yuba City, CA 95991
Property Description
Price Reduced! East Hillcrest gem on a rare .40-acre private lot. This 4 bed/2.5 bath two-story features vaulted wood-beam ceilings, a stacked stone fireplace, and a covered patio. Live self-sufficient: private well, septic, and 42-panel NEM2 leased solar mean no water bill and minimal PG&E bills. New GAF roof, 3-year-old Trane HVAC, quartz kitchen refresh. All appliances included. Lowest-priced home in East Hillcrest. Seller open to a rate buydown.
Features & Amenities
Property Details
Mortgage Calculator
Current Rates
Comparative Market Analysis
Residential Tier · 3 active · 4 closed
Yuba City · Single Family Residence
Listed 10.7% above the median closed sale of $542,000. Price per sqft ($224) is a 16% discount to closed comps ($267). Closed comps sold at 101% of list — strong seller's market.
Price Position
Positioned above the market — commands a premium.
Active Properties (3)
Active Comparables
| Address | City | Year | BD | BTH | SqFt | LotSz | LP/SqFt | LP | DIM | Score |
|---|---|---|---|---|---|---|---|---|---|---|
| 1079 Twins | Yuba City | 2002 | 4 | 3 | 2,174 | 6,970 | $248 | $539,900 | 30 | 78 |
| 944 Sanborn | Yuba City | 1964 | 3 | 3 | 2,056 | 16,553 | $277 | $569,900 | 51 | 68 |
| 1358 Ruth Avenue | Yuba City | 1981 | 3 | 4 | 2,400 | 42,253 | $287 | $689,000 | 87 | 56 |
| Total: 3 · Average | 3.3 | 3.3 | 2,210 | 21,925.333 | $270.667 | $599,600 | 56 | |||
| Median | 2,174 | $569,900 | ||||||||
Closed Properties (4)
Closed Comparables
| Address | City | Year | Date | BD | BTH | SqFt | LotSz | LP | SP | SP/SqFt | SP/LP | DIM | Score |
|---|---|---|---|---|---|---|---|---|---|---|---|---|---|
| 1839 Nelda Court | Yuba City | 1993 | 11/09/2026 | 5 | 3 | 2,394 | 7,405 | $539,000 | $550,000 | $230 | 1.02 | 181 | 75 |
| 1160 Bryn Mawr Dr | Yuba City | 1987 | 11/21/2025 | 3 | 2 | 2,238 | 9,583 | $534,000 | $534,000 | $239 | 1.00 | 24 | 52 |
| 1710 Edwards Lane | Yuba City | 1963 | 01/15/2026 | 3 | 2 | 1,877 | 57,499 | $549,000 | $520,000 | $277 | 0.95 | 157 | 46 |
| 2158 Holcomb Avenue | Yuba City | 1970 | 08/28/2026 | 2 | 2 | 1,746 | 46,609 | $525,000 | $560,000 | $321 | 1.07 | 29 | 42 |
| Total: 4 · Average | 3.3 | 2.3 | 2,063.75 | 30,274 | $541,000 | $541,000 | $266.75 | — | 97.75 | ||||
| Median | 2,238 | $550,000 | $550,000 | ||||||||||
Market Analysis
List vs Sale $/SqFt
Sale Price Trend
Days on Market
Sale vs List Price
This analysis was generated automatically from MLS data. For an in-depth, human-reviewed valuation, contact Joseph Sardella at josephsardella@gmail.com.