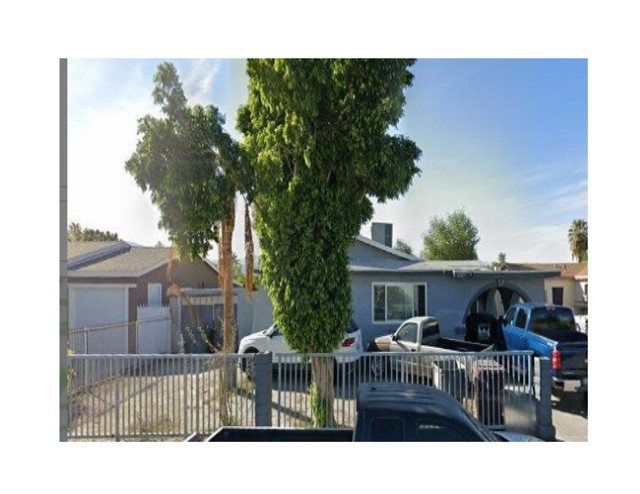
47267 Blue Jay Street, Indio, CA 92201
47267 Blue Jay Street, Indio, CA 92201
Property Description
Great FIXER - Bring Your Hammer and Tools - Great Owner Contractor Prperty - Nice up and Coming Area - Good Bones - Basic Cosmetic and Upgrade Needed and you have a Fantastic home Built In 1972 at A Discount Accordingly ! Better Hurry We Already Have 2 offers !
Features & Amenities
Property Details
Mortgage Calculator
Current Rates
About Desert Shores
This property is located in Desert Shores, a community in Indio. Explore more listings in this neighborhood to compare options and pricing.
View Desert Shores ListingsComparative Market Analysis
Affordable Tier · 1 active · 5 closed
Desert Shores · Indio · Single Family Residence
Listed in line with the median closed sale of $270,000. Closed comps sold at 101% of list — strong seller's market.
Price Position
Aligned with the market — fair pricing for the comps.
Active Properties (1)
Active Comparables
| Address | City | Year | BD | BTH | SqFt | LotSz | LP/SqFt | LP | DIM | Score |
|---|---|---|---|---|---|---|---|---|---|---|
| 82300 Garden Avenue | Indio | 1970 | 6 | 2 | 1,990 | 7,405 | $138 | $275,000 | 34 | 49 |
| Total: 1 · Average | 6.0 | 2.0 | 1,990 | 7,405 | $138 | $275,000 | 34 | |||
| Median | 1,990 | $275,000 | ||||||||
Closed Properties (5)
Closed Comparables
| Address | City | Year | Date | BD | BTH | SqFt | LotSz | LP | SP | SP/SqFt | SP/LP | DIM | Score |
|---|---|---|---|---|---|---|---|---|---|---|---|---|---|
| 82639 Crest Ave | Indio | 1957 | 10/14/2026 | 3 | 2 | 1,101 | 10,454 | $270,000 | $270,000 | $245 | 1.00 | 0 | 65 |
| 52210 Jennifer Way | Coachella | 1969 | 12/12/2025 | 3 | 2 | 1,120 | 6,098 | $300,000 | $300,000 | $268 | 1.00 | 9 | 59 |
| 85164 Bagdad Avenue | Coachella | 1957 | 04/27/2026 | 3 | 1 | 1,099 | 6,970 | $299,000 | $299,000 | $272 | 1.00 | 61 | 59 |
| 82625 Requa Avenue | Indio | 1952 | 07/06/2026 | 2 | 2 | 1,549 | 7,405 | $230,000 | $252,200 | $163 | 1.10 | 145 | 59 |
| 84590 Vera Cruz | Coachella | 1980 | 12/04/2025 | 2 | 1 | 954 | 4,356 | $265,000 | $255,500 | $268 | 0.96 | 262 | 59 |
| Total: 5 · Average | 2.6 | 1.6 | 1,164.6 | 7,056.6 | $275,340 | $275,340 | $243.2 | — | 95.4 | ||||
| Median | 1,101 | $270,000 | $270,000 | ||||||||||
Market Analysis
List vs Sale $/SqFt
Sale Price Trend
Days on Market
Sale vs List Price
This analysis was generated automatically from MLS data. For an in-depth, human-reviewed valuation, contact Joseph Sardella at josephsardella@gmail.com.