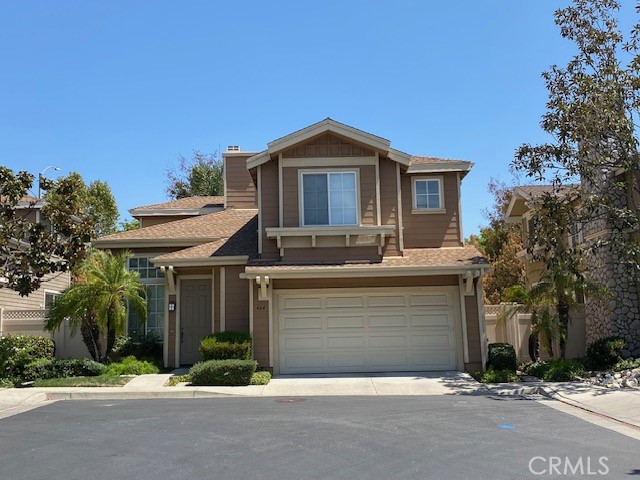
464 Middlebury Court, Claremont, CA 91711
464 Middlebury Court, Claremont, CA 91711
Property Description
Huge Price Reduction! Welcome to 464 Middlebury Ct. featuring 3 bedrooms, 2.5 bathrooms, upstairs laundry, living room with fireplace, dining area, kitchen and family area with an attached 2 car garage. This home offers the easiest access getting in and out of the garage. Close to shopping, schools, parks plus the Claremont loop and so much more. Why rent when you can own in North Claremont. Fantastic price for your next home.
Features & Amenities
Property Details
Mortgage Calculator
Current Rates
Comparative Market Analysis
Residential Tier · 5 active · 5 closed
Claremont · Single Family Residence
Listed 4.7% below the median closed sale of $760,000. Closed comps sold at 102% of list — strong seller's market.
Price Position
Aligned with the market — fair pricing for the comps.
Active Properties (5)
Active Comparables
| Address | City | Year | BD | BTH | SqFt | LotSz | LP/SqFt | LP | DIM | Score |
|---|---|---|---|---|---|---|---|---|---|---|
| 1593 Bayport | Upland | 2010 | 3 | 3 | 1,983 | 2,635 | $343 | $680,000 | 138 | 75 |
| 881 Pear Court | Upland | 2019 | 4 | 3 | 1,759 | 1,152 | $418 | $734,900 | 41 | 74 |
| 434 Champlain | Claremont | 1974 | 3 | 2 | 1,436 | 5,028 | $575 | $825,000 | 59 | 74 |
| 2004 Dewdrop | Upland | 2024 | 4 | 3 | 1,868 | 1,001 | $414 | $773,000 | 125 | 67 |
| 1555 Whieldon | Upland | 2010 | 4 | 3 | 2,351 | 4,188 | $330 | $775,000 | 10 | 62 |
| Total: 5 · Average | 3.6 | 2.8 | 1,879.4 | 2,800.8 | $416 | $757,580 | 74.6 | |||
| Median | 1,868 | $773,000 | ||||||||
Closed Properties (5)
Closed Comparables
| Address | City | Year | Date | BD | BTH | SqFt | LotSz | LP | SP | SP/SqFt | SP/LP | DIM | Score |
|---|---|---|---|---|---|---|---|---|---|---|---|---|---|
| 432 Middlebury Court | Claremont | 1999 | 10/15/2026 | 3 | 3 | 1,509 | 2,208 | $757,500 | $745,000 | $494 | 0.98 | 111 | 92 |
| 2041 New Haven Avenue | Claremont | 1999 | 08/03/2026 | 3 | 3 | 1,591 | 2,438 | $829,000 | $827,000 | $520 | 1.00 | 42 | 85 |
| 429 Champlain | Claremont | 1974 | 10/22/2026 | 3 | 2 | 1,436 | 4,339 | $770,000 | $760,000 | $529 | 0.99 | 49 | 76 |
| 411 Champlain Dr | Claremont | 1974 | 08/12/2026 | 4 | 2 | 1,436 | 5,712 | $749,900 | $730,000 | $508 | 0.97 | 89 | 72 |
| 295 Blue Mountain Way | Claremont | 1978 | 02/24/2026 | 3 | 2 | 1,593 | 11,803 | $699,000 | $810,000 | $508 | 1.16 | 20 | 71 |
| Total: 5 · Average | 3.2 | 2.4 | 1,513 | 5,300 | $774,400 | $774,400 | $511.8 | — | 62.2 | ||||
| Median | 1,509 | $760,000 | $760,000 | ||||||||||
Market Analysis
List vs Sale $/SqFt
Sale Price Trend
Days on Market
Sale vs List Price
This analysis was generated automatically from MLS data. For an in-depth, human-reviewed valuation, contact Joseph Sardella at josephsardella@gmail.com.