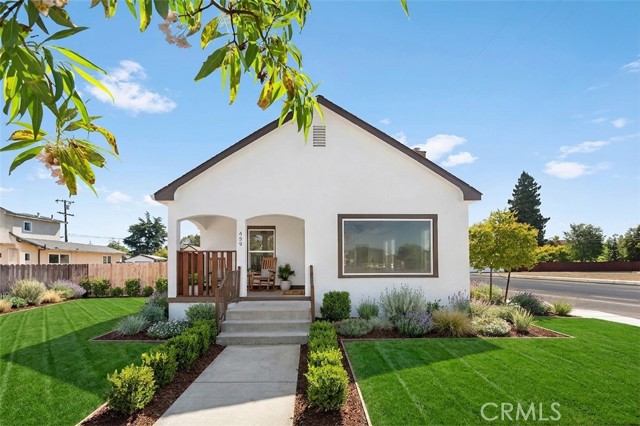
439 3rd Street, Orland, CA 95963
439 3rd Street, Orland, CA 95963
Property Description
Turn key Orland charmer! This 2 bedroom home has undergone a massive transformation inside and out and is ready for its new owner. Blank slate yard front and back. Come bring your landscape visions to life! Detached garage and alley access offer the perfect set up for projects and storage. Ideally located on a large corner lot near schools, local restaurants, and shopping. Make the call, lets go take a look!
Features & Amenities
Property Details
Mortgage Calculator
Current Rates
Comparative Market Analysis
Affordable Tier · 5 active · 5 closed
Orland · Single Family Residence
Listed 3.6% above the median closed sale of $307,000. Closed comps sold at 100% of list — strong seller's market.
Price Position
Aligned with the market — fair pricing for the comps.
Active Properties (5)
Active Comparables
| Address | City | Year | BD | BTH | SqFt | LotSz | LP/SqFt | LP | DIM | Score |
|---|---|---|---|---|---|---|---|---|---|---|
| 15 Swift | Orland | 1960 | 3 | 1 | 1,280 | 8,712 | $273 | $349,900 | 26 | 81 |
| 327 EAST Street | Orland | 1977 | 3 | 2 | 1,290 | 6,969 | $275 | $355,000 | 50 | 76 |
| 1219 Walters | Orland | 1957 | 3 | 2 | 1,212 | 9,350 | $301 | $365,000 | 3 | 76 |
| 1020 Date Street | Orland | 1998 | 3 | 2 | 1,195 | 6,534 | $283 | $338,000 | 9 | 75 |
| 139 E Yolo Street | Orland | 1962 | 3 | 2 | 1,288 | 15,246 | $279 | $359,000 | 36 | 75 |
| Total: 5 · Average | 3.0 | 1.8 | 1,253 | 9,362.2 | $282.2 | $353,380 | 24.8 | |||
| Median | 1,280 | $355,000 | ||||||||
Closed Properties (5)
Closed Comparables
| Address | City | Year | Date | BD | BTH | SqFt | LotSz | LP | SP | SP/SqFt | SP/LP | DIM | Score |
|---|---|---|---|---|---|---|---|---|---|---|---|---|---|
| 508 A Street | Orland | 1956 | 07/24/2026 | 2 | 1 | 1,196 | 7,841 | $259,000 | $275,000 | $230 | 1.06 | 38 | 87 |
| 17 Colusa Street | Orland | 1949 | 05/22/2026 | 2 | 1 | 888 | 6,762 | $299,000 | $285,710 | $322 | 0.96 | 43 | 85 |
| 113 Swift Street | Orland | 1948 | 01/12/2026 | 2 | 1 | 1,129 | 9,583 | $305,000 | $307,000 | $272 | 1.01 | 47 | 80 |
| 64 Tehama | Orland | 1954 | 12/30/2025 | 3 | 1 | 1,115 | 9,583 | $340,000 | $350,000 | $314 | 1.03 | 22 | 77 |
| 65 Colusa | Orland | 1924 | 05/13/2026 | 3 | 2 | 1,237 | 8,276 | $360,000 | $350,000 | $283 | 0.97 | 52 | 70 |
| Total: 5 · Average | 2.4 | 1.2 | 1,113 | 8,409 | $313,542 | $313,542 | $284.2 | — | 40.4 | ||||
| Median | 1,129 | $307,000 | $307,000 | ||||||||||
Market Analysis
List vs Sale $/SqFt
Sale Price Trend
Days on Market
Sale vs List Price
This analysis was generated automatically from MLS data. For an in-depth, human-reviewed valuation, contact Joseph Sardella at josephsardella@gmail.com.