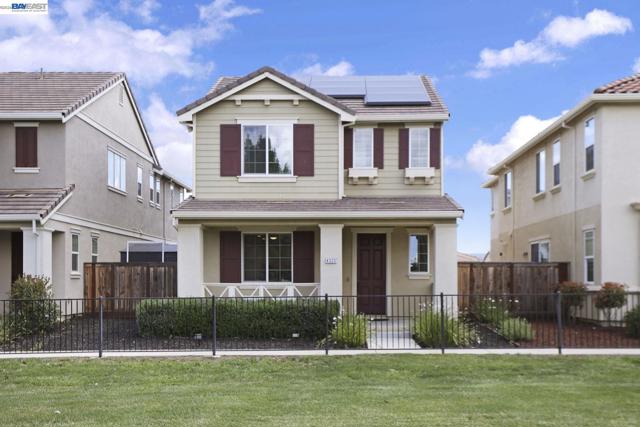
4323 Lennox Ln, Tracy, CA 95377
4323 Lennox Ln, Tracy, CA 95377
Property Description
Imagine owning a 2020-built home in South Tracy’s Brookview neighborhood with just steps from the ACE Train for a seamless commute. Step outside to the park right out front. Inside, an upgraded kitchen flows into a bright open layout bathed in natural light. With owned solar, an EV charger, no HOA, no Mello-Roos, and top Jefferson schools, this home blends financial advantages with lifestyle ease. Ready for its next chapter!
Features & Amenities
Property Details
Mortgage Calculator
Current Rates
Comparative Market Analysis
Residential Tier · 3 active · 5 closed
Tracy · Single Family Residence
Listed 5.3% below the median closed sale of $685,000. Closed comps sold at 101% of list — strong seller's market.
Price Position
Priced below the market — value advantage over the field.
Active Properties (3)
Active Comparables
| Address | City | Year | BD | BTH | SqFt | LotSz | LP/SqFt | LP | DIM | Score |
|---|---|---|---|---|---|---|---|---|---|---|
| 7149 Diamond Ave | Tracy | 2024 | 3 | 3 | 1,723 | 3,018 | $395 | $679,950 | 129 | 74 |
| 230 Tassajera Ct | Tracy | 1989 | 4 | 3 | 2,009 | 5,027 | $326 | $655,000 | 10 | 60 |
| 448 Burlington Drive | Tracy | 2000 | 5 | 3 | 2,298 | 3,697 | $261 | $599,950 | 25 | 58 |
| Total: 3 · Average | 4.0 | 3.0 | 2,010 | 3,914 | $327.333 | $644,966.667 | 54.666666666666664 | |||
| Median | 2,009 | $655,000 | ||||||||
Closed Properties (5)
Closed Comparables
| Address | City | Year | Date | BD | BTH | SqFt | LotSz | LP | SP | SP/SqFt | SP/LP | DIM | Score |
|---|---|---|---|---|---|---|---|---|---|---|---|---|---|
| 4384 Lennox Ln | Tracy | 2019 | 01/16/2026 | 3 | 3 | 1,814 | 5,539 | $669,900 | $669,900 | $369 | 1.00 | 51 | 85 |
| 4632 Regis Dr | Tracy | 2002 | 02/24/2026 | 3 | 3 | 1,858 | 5,000 | $698,000 | $710,000 | $382 | 1.02 | 28 | 83 |
| 4738 Bonsai Ave | Tracy | 2003 | 06/17/2026 | 3 | 2 | 1,588 | 6,790 | $689,000 | $710,000 | $447 | 1.03 | 40 | 78 |
| 39 Wisteria Lane | Tracy | 2003 | 12/23/2025 | 4 | 2 | 1,841 | 10,040 | $675,000 | $685,000 | $372 | 1.01 | 43 | 74 |
| 1100 Cherry Blossom Ln | Tracy | 2000 | 02/13/2026 | 4 | 3 | 2,032 | 5,934 | $679,000 | $682,000 | $336 | 1.00 | 28 | 72 |
| Total: 5 · Average | 3.4 | 2.6 | 1,826.6 | 6,660.6 | $691,380 | $691,380 | $381.2 | — | 38 | ||||
| Median | 1,841 | $685,000 | $685,000 | ||||||||||
Market Analysis
List vs Sale $/SqFt
Sale Price Trend
Days on Market
Sale vs List Price
This analysis was generated automatically from MLS data. For an in-depth, human-reviewed valuation, contact Joseph Sardella at josephsardella@gmail.com.