419 North Chandler Ave #503, Monterey Park, CA 91754
419 North Chandler Ave #503, Monterey Park, CA 91754
Property Description
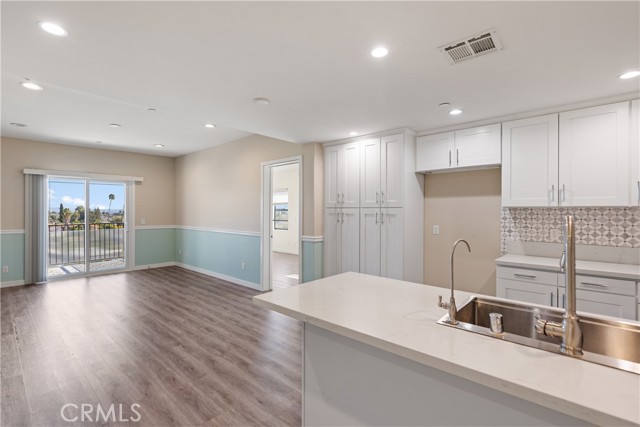
A stunning city backdrop, refined interiors, and an elevated sense of style make this residence truly special! Situated on a desirable higher floor, this beautifully upgraded 2-bedroom, 2.5-bath condo offers sweeping city views and a sophisticated living experience in the heart of Monterey Park. The bright, open-concept design is complemented by tasteful upgrades and contemporary finishes, creating an inviting atmosphere that feels both luxurious and effortlessly comfortable. Expansive windows bring in abundant natural light while showcasing picturesque city views, adding a beautiful sense of openness throughout. Whether hosting friends or unwinding after a long day, this thoughtfully designed residence offers the perfect setting to enjoy the comforts of home. Beyond the beautiful interiors, an exceptional location puts the best of Monterey Park within easy reach. Enjoy convenient access to Ralphs, GW Supermarket, and Atlantic Times Square, home to an exciting selection of restaurants, shopping, and entertainment, including an AMC movie theater. Located within the highly regarded Alhambra Unified School District and just minutes from the I-10 freeway, this home offers an ideal combination of modern luxury and everyday convenience. An exceptional opportunity to enjoy elevated city living with beautiful views, stylish upgrades, and a location that truly has it all!
Features & Amenities
Property Details
Mortgage Calculator
Current Rates
Comparative Market Analysis
Affordable Tier · 5 active · 5 closed
Monterey Park · Condominium
Listed 13.9% above the median closed sale of $685,000. Price per sqft ($661) is a 11% premium to closed comps ($596). Expect a longer timeline — comps averaged 122 days on market.
Price Position
Positioned above the market — commands a premium.
Active Properties (5)
Active Comparables
| Address | City | Year | BD | BTH | SqFt | LotSz | LP/SqFt | LP | DIM | Score |
|---|---|---|---|---|---|---|---|---|---|---|
| 419 Chandler Avenue | Monterey Park | 2022 | 2 | 3 | 1,153 | 87,942 | $605 | $698,000 | 9 | 99 |
| 600 Atlantic Boulevard | Monterey Park | 2010 | 2 | 2 | 1,340 | 287,163 | $536 | $718,000 | 2 | 82 |
| 419 Chandler Avenue | Monterey Park | 2021 | 3 | 3 | 1,611 | 87,942 | $546 | $880,000 | 179 | 82 |
| 128 Moore Avenue | Monterey Park | 1984 | 3 | 3 | 1,328 | 20,298 | $526 | $698,000 | 9 | 77 |
| 125 Chandler APT D | Monterey Park | 1982 | 3 | 3 | 1,365 | 10,434 | $538 | $735,000 | 95 | 76 |
| Total: 5 · Average | 2.6 | 2.8 | 1,359.4 | 98,755.8 | $550.2 | $745,800 | 58.8 | |||
| Median | 1,340 | $718,000 | ||||||||
Closed Properties (5)
Closed Comparables
| Address | City | Year | Date | BD | BTH | SqFt | LotSz | LP | SP | SP/SqFt | SP/LP | DIM | Score |
|---|---|---|---|---|---|---|---|---|---|---|---|---|---|
| 419 Chandler | Monterey Park | 2022 | 07/01/2026 | 2 | 3 | 1,180 | 87,942 | $699,000 | $675,000 | $572 | 0.97 | 96 | 98 |
| 419 Chandler Avenue | Monterey Park | 2022 | 04/13/2026 | 2 | 3 | 1,180 | 87,942 | $698,000 | $675,000 | $572 | 0.97 | 194 | 96 |
| 419 Chandler Avenue | Monterey Park | 2021 | 10/26/2026 | 2 | 3 | 1,110 | 84,123 | $729,000 | $685,000 | $617 | 0.94 | 52 | 95 |
| 419 Chandler Avenue | Monterey Park | 2022 | 05/05/2026 | 2 | 3 | 1,180 | 87,942 | $725,000 | $725,000 | $614 | 1.00 | 53 | 94 |
| 419 Chandler Avenue | Monterey Park | 2022 | 04/23/2026 | 2 | 3 | 1,153 | 87,942 | $708,000 | $700,000 | $607 | 0.99 | 216 | 94 |
| Total: 5 · Average | 2.0 | 3.0 | 1,160.6 | 87,178.2 | $692,000 | $692,000 | $596.4 | — | 122.2 | ||||
| Median | 1,180 | $685,000 | $685,000 | ||||||||||
Market Analysis
List vs Sale $/SqFt
Sale Price Trend
Days on Market
Sale vs List Price
This analysis was generated automatically from MLS data. For an in-depth, human-reviewed valuation, contact Joseph Sardella at josephsardella@gmail.com.