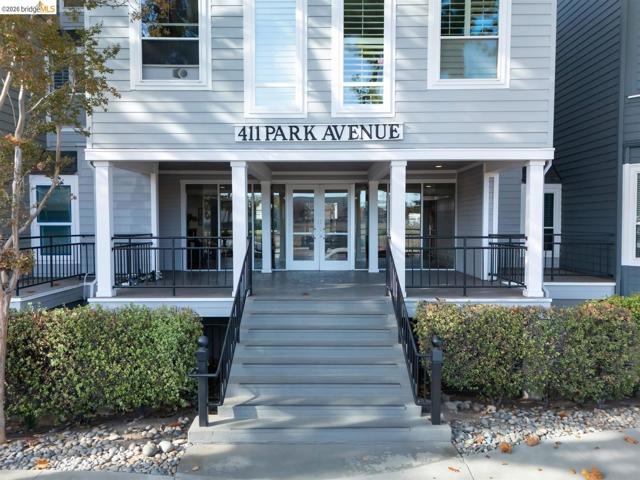
411 Park AVE, 206, San Jose, CA 95110
411 Park AVE, 206, San Jose, CA 95110
Property Description
Downtown convenience with room to make it your own! This 2-bedroom, 2-bath Parkside condo offers approximately 1,048 square feet, a private balcony and the everyday convenience of an in-unit washer and dryer. Original finishes provide an opportunity to add your personal style over time. Enjoy a charming central courtyard, exercise room, community recreation room and one designated parking space. Centrally located near downtown San Jose's dining, shopping and entertainment, with convenient access to SAP Center, San Fernando light rail and Diridon Station for Caltrain, ACE and Amtrak connections. An appealing combination of space, amenities and location.
Features & Amenities
Property Details
Mortgage Calculator
Current Rates
About Downtown
This property is located in Downtown, a community in San Jose. Explore more listings in this neighborhood to compare options and pricing.
View Downtown ListingsComparative Market Analysis
Affordable Tier · 1 active · 5 closed
Downtown · San Jose · Condominium
Listed 9.1% below the median closed sale of $605,000. Price per sqft ($525) is a 19% discount to closed comps ($646).
Price Position
Priced below the market — value advantage over the field.
Active Properties (1)
Active Comparables
| Address | City | Year | BD | BTH | SqFt | LotSz | LP/SqFt | LP | DIM | Score |
|---|---|---|---|---|---|---|---|---|---|---|
| 88 Bush St | San Jose | 2008 | 1 | 2 | 841 | 898 | $743 | $625,000 | 66 | 79 |
| Total: 1 · Average | 1.0 | 2.0 | 841 | 898 | $743 | $625,000 | 66 | |||
| Median | 841 | $625,000 | ||||||||
Closed Properties (5)
Closed Comparables
| Address | City | Year | Date | BD | BTH | SqFt | LotSz | LP | SP | SP/SqFt | SP/LP | DIM | Score |
|---|---|---|---|---|---|---|---|---|---|---|---|---|---|
| 232 Race St | San Jose | 1986 | 05/15/2026 | 2 | 2 | 740 | 900 | $624,985 | $605,000 | $818 | 0.97 | 65 | 69 |
| 88 San Fernando St | San Jose | 2008 | 12/29/2025 | 1 | 1 | 732 | 0 | $498,000 | $486,000 | $664 | 0.98 | 111 | 67 |
| 20 Ryland Park Drive | San Jose | 2001 | 07/07/2026 | 1 | 2 | 950 | 685 | $500,000 | $490,000 | $516 | 0.98 | 132 | 67 |
| 1375 Lick Ave | San Jose | 2009 | 09/15/2026 | 2 | 2 | 1,096 | 1,496 | $630,000 | $630,000 | $575 | 1.00 | 7 | 66 |
| 682 Teatree Ct | San Jose | 1988 | 08/27/2026 | 2 | 2 | 922 | 1,960 | $599,888 | $605,000 | $656 | 1.01 | 42 | 65 |
| Total: 5 · Average | 1.6 | 1.8 | 888 | 1,260.25 | $563,200 | $563,200 | $645.8 | — | 71.4 | ||||
| Median | 922 | $605,000 | $605,000 | ||||||||||
Market Analysis
List vs Sale $/SqFt
Sale Price Trend
Days on Market
Sale vs List Price
This analysis was generated automatically from MLS data. For an in-depth, human-reviewed valuation, contact Joseph Sardella at josephsardella@gmail.com.