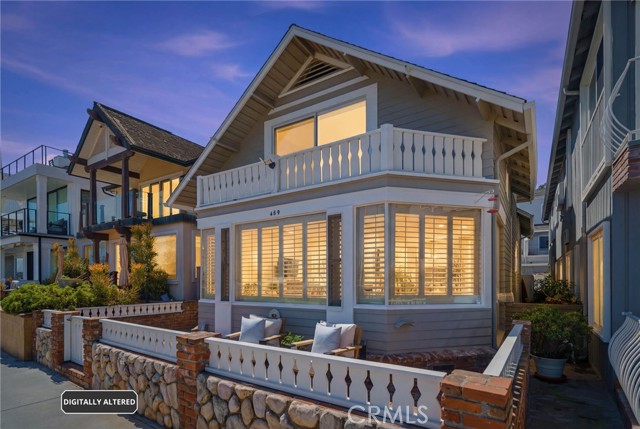
409 East Edgewater, Newport Beach, CA 92661
409 East Edgewater, Newport Beach, CA 92661
Property Description
Newly Priced — A Rare Bayfront Opportunity on the Newport Beach Peninsula. An exceptional opportunity to own a distinctive waterfront residence in one of Newport Beach’s most sought-after coastal locations. This 4-bedroom, 3-bath home offers direct bay views and its own private boat dock, creating an ideal setting for the quintessential Southern California waterfront lifestyle. The residence also features a versatile bonus room ideal for a home office, den, or flex space. Enjoy harbor views from your doorstep, boating directly from your private dock, and convenient access to the Peninsula’s beaches, dining, shopping, and recreation. For buyers seeking a premier bayfront location, private dock, and the opportunity to own a truly special property on the Newport Beach Peninsula, 409 E. Edgewater deserves a closer look.
Features & Amenities
Property Details
Mortgage Calculator
Current Rates
Comparative Market Analysis
Luxury Tier · 5 active · 5 closed
Newport Beach · Single Family Residence
Listed 5.2% above the median closed sale of $7,600,000. Price per sqft ($2,928) is a 22% discount to closed comps ($3,748). Luxury tier — fewer comparable sales widen the confidence range.
Price Position
Positioned above the market — commands a premium.
Active Properties (5)
Active Comparables
| Address | City | Year | BD | BTH | SqFt | LotSz | LP/SqFt | LP | DIM | Score |
|---|---|---|---|---|---|---|---|---|---|---|
| 1002 Balboa Boulevard | Newport Beach | 1928 | 4 | 4 | 2,987 | 3,825 | $2,677 | $8.00M | 9 | 85 |
| 306 Oceanfront | Newport Beach | 2027 | 4 | 5 | 2,520 | 2,400 | $3,274 | $8.25M | 17 | 83 |
| 1508 Balboa Boulevard | Newport Beach | 2015 | 4 | 6 | 3,316 | 2,700 | $2,109 | $7.00M | 247 | 75 |
| 1416 Balboa Boulevard | Newport Beach | 2022 | 5 | 6 | 3,349 | 2,700 | $2,681 | $8.98M | 67 | 72 |
| 115 Grand Canal | Newport Beach | 2002 | 3 | 5 | 2,503 | 2,550 | $2,917 | $7.30M | 4 | 66 |
| Total: 5 · Average | 4.0 | 5.2 | 2,935 | 2,835 | $2,731.6 | $7.90M | 68.8 | |||
| Median | 2,987 | $8.00M | ||||||||
Closed Properties (5)
Closed Comparables
| Address | City | Year | Date | BD | BTH | SqFt | LotSz | LP | SP | SP/SqFt | SP/LP | DIM | Score |
|---|---|---|---|---|---|---|---|---|---|---|---|---|---|
| 225 Diamond | Newport Beach | 2026 | 09/29/2026 | 4 | 5 | 2,312 | 2,550 | $7.95M | $7.58M | $3,281 | 0.95 | 56 | 77 |
| 117 Bay Front | Newport Beach | 1947 | 01/23/2026 | 5 | 4 | 2,787 | 2,550 | $8.15M | $8.00M | $2,870 | 0.98 | 162 | 76 |
| 2771 Bayshore | Newport Beach | 1946 | 08/31/2026 | 4 | 3 | 2,605 | 4,000 | $8.00M | $7.83M | $3,004 | 0.98 | 26 | 71 |
| 612 Harbor Island Drive | Newport Beach | 1977 | 01/07/2026 | 4 | 5 | 3,337 | 5,000 | $8.00M | $7.60M | $2,277 | 0.95 | 43 | 71 |
| 1207 Bay Front | Newport Beach | 1932 | 10/14/2026 | 2 | 2 | 992 | 2,550 | $7.50M | $7.25M | $7,308 | 0.97 | 225 | 67 |
| Total: 5 · Average | 3.8 | 3.8 | 2,406.6 | 3,330 | $7.65M | $7.65M | $3,748 | — | 102.4 | ||||
| Median | 2,605 | $7.60M | $7.60M | ||||||||||
Market Analysis
List vs Sale $/SqFt
Sale Price Trend
Days on Market
Sale vs List Price
This analysis was generated automatically from MLS data. For an in-depth, human-reviewed valuation, contact Joseph Sardella at josephsardella@gmail.com.