1 / 7
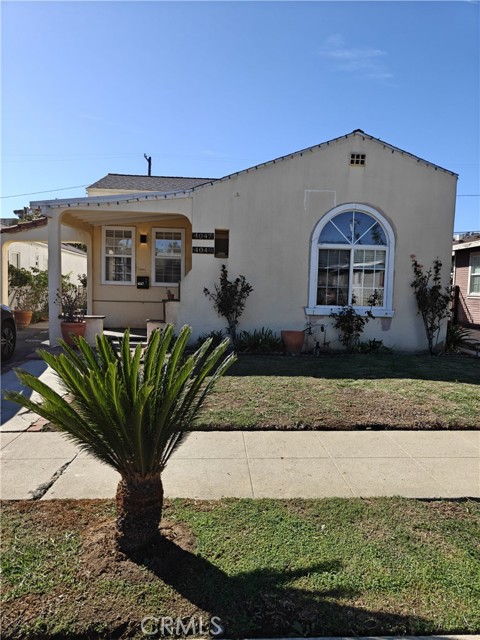
4047 West Avenue 40, Glassell Park, CA 90065
$1.13M4bd · 2ba · 1,866 sqft
Lot 5,206 sqft•Duplex•Active•11d on market•MLS# SR-26239724
4047 West Avenue 40, Glassell Park, CA 90065
MLS# SR-26239724•Residential•Duplex
Active11 days on market
$1,125,000
4
Beds
2
Baths
1,866
Sq Ft
5,206
Lot Sq Ft
1929
Year Built
Property Description
This Duplex is in 'Move In' Condition. Situated on a lovely quiet street in Glassell Park this property is close to the freeway and to all conveniences. Opportunity to live in one unit and rent out the other. Both units are 2 bedroom 2 bath. Detached Garage in back for each unit. Fully paid solar system installed!
Features & Amenities
FeeBuilt 1929
Property Details
Land Type
Fee
Year Built
1929
Property Type
Residential
Property Subtype
Duplex
Heating
None
Cooling
Evaporative Cooling, None
Flooring
Laminate
Roof
Shingle
City
Glassell Park
Zip Code
90065
County
Los Angeles
Mortgage Calculator
Current Rates
$
$
%
Monthly Payment
$5,688.61
Principal & Interest
Loan Amount
$900,000
Total Interest
$1,147,900
Total Payment Over 30 Years
$2,047,900
This calculator provides estimates only. Actual mortgage payments may include taxes, insurance, HOA fees, and PMI. Contact a lender for accurate quotes.
Comparative Market Analysis
Residential Tier · 5 active · 5 closed
4047 West Avenue 40, Glassell Park, CA 90065
Glassell Park · Duplex
$1.13M
Residential TierBeds
4
Baths
2
Sqft
1,866
Lot
5,206 sqft
Year
1929
$/Sqft
$603
Pool: No✓
Spa: No✓
Listed in line with the median closed sale of $1,100,000. Closed comps sold at 105% of list — strong seller's market.
Price Position
Aligned with the market — fair pricing for the comps.
At market
Subject listed at $1.13M· $603/sqft
Total list price
Closed comps
vs closed median $1.10M
+$25K (+2.3%)
Active comps
vs active median $1.20M
−$75K (−6.3%)
Price per sqft
Closed compsinsufficient comp data
Active comps
vs active avg $/sqft $618
−$15 (−2.4%)
Active Properties (5)
Active Comparables
| Address | City | Year | BD | BTH | SqFt | LotSz | LP/SqFt | LP | DIM | Score |
|---|---|---|---|---|---|---|---|---|---|---|
| 1008 Windsor Road | Glendale | 1906 | 5 | 2 | 1,928 | 8,394 | $622 | $1.20M | 11 | 75 |
| 900 Windsor | Glendale | 1916 | 4 | 3 | 1,916 | 7,798 | $626 | $1.20M | 14 | 74 |
| 128 Lukens Place | Glendale | 1941 | 4 | 3 | 1,462 | 5,107 | $813 | $1.19M | 62 | 70 |
| 6558 FIGUEROA | Highland Park | 2006 | 8 | 4 | 2,350 | 5,091 | $531 | $1.25M | 6 | 48 |
| 514 River Street | Los Angeles | 1937 | 6 | 5 | 2,566 | 6,472 | $498 | $1.28M | 85 | 46 |
| Total: 5 · Average | 5.4 | 3.4 | 2,044.4 | 6,572.4 | $618 | $1.22M | 35.6 | |||
| Median | 1,928 | $1.20M | ||||||||
Closed Properties (5)
Closed Comparables
| Address | City | Year | Date | BD | BTH | SqFt | LotSz | LP | SP | SP/SqFt | SP/LP | DIM | Score |
|---|---|---|---|---|---|---|---|---|---|---|---|---|---|
| 1205 Tyler Street | Glendale | 1941 | 06/18/2026 | 3 | 2 | 1,710 | 6,045 | $1.05M | $1.10M | $643 | 1.05 | 28 | 77 |
| 1615 Adams Street | Glendale | 1947 | 12/09/2025 | 4 | 2 | 2,014 | 6,841 | $950,000 | $1.10M | $546 | 1.16 | 42 | 76 |
| 407 Verdugo Road | Glendale | 1927 | 05/15/2026 | 4 | 3 | 2,130 | 7,511 | $1.20M | $1.25M | $587 | 1.04 | 36 | 70 |
| 3937 Revere | Los Angeles | 1924 | 07/01/2026 | 4 | 2 | 1,175 | 5,401 | $1.03M | $1.06M | $902 | 1.02 | 136 | 67 |
| 2973 Avenue 33 | Los Angeles | 1965 | 01/13/2026 | 5 | 3 | 2,144 | 8,042 | $1.15M | $1.10M | $513 | 0.96 | 209 | 62 |
| Total: 5 · Average | 4.0 | 2.4 | 1,834.6 | 6,768 | $1.12M | $1.12M | $638.2 | — | 90.2 | ||||
| Median | 2,014 | $1.10M | $1.10M | ||||||||||
Market Analysis
List vs Sale $/SqFt
Sale Price Trend
Days on Market
Sale vs List Price
AI-generated CMA
This analysis was generated automatically from MLS data. For an in-depth, human-reviewed valuation, contact Joseph Sardella at josephsardella@gmail.com.