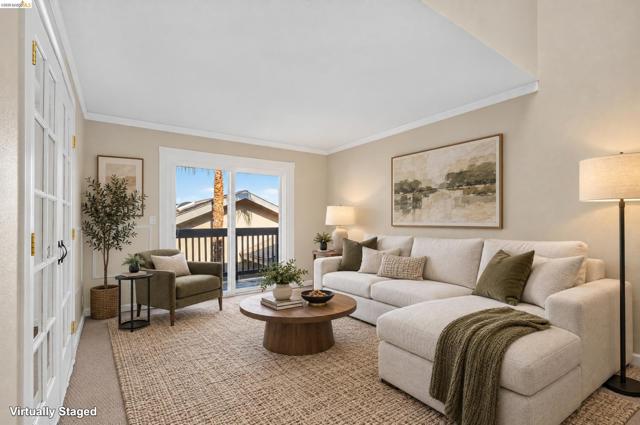
3849 Vineyard Avenue, C, Pleasanton, CA
3849 Vineyard Avenue, C, Pleasanton, CA
Property Description
Welcome to 3849 Vineyard Avenue, a 2-bedroom, 2-bathroom condo. Move in ready, end-unit offers a versatile layout designed for easy everyday living. Newly painted, new carpet, one car garage with attached storage room and in- unit laundry. An excellent opportunity for buyers seeking low-maintenance living or as an investment in an established Pleasanton community. Conveniently located, less than a 5 min drive to restaurants, cafés, and great shopping. Plus, having the iconic Meadowlark Dairy local treat is always within reach!
Features & Amenities
Property Details
Mortgage Calculator
Current Rates
Comparative Market Analysis
Affordable Tier · 1 active · 5 closed
Pleasanton · Condominium
Listed in line with the median closed sale of $496,000.
Price Position
Aligned with the market — fair pricing for the comps.
Active Properties (1)
Active Comparables
| Address | City | Year | BD | BTH | SqFt | LotSz | LP/SqFt | LP | DIM | Score |
|---|---|---|---|---|---|---|---|---|---|---|
| 3839 Vineyard Ave | Pleasanton | 1983 | 2 | 2 | 859 | 0 | $626 | $538,000 | 51 | 94 |
| Total: 1 · Average | 2.0 | 2.0 | 859 | 0 | $626 | $538,000 | 51 | |||
| Median | 859 | $538,000 | ||||||||
Closed Properties (5)
Closed Comparables
| Address | City | Year | Date | BD | BTH | SqFt | LotSz | LP | SP | SP/SqFt | SP/LP | DIM | Score |
|---|---|---|---|---|---|---|---|---|---|---|---|---|---|
| 74 PETERS AVE | Pleasanton | 1988 | 05/05/2026 | 1 | 1 | 702 | 0 | $515,000 | $515,000 | $734 | 1.00 | 32 | 75 |
| 2216 Segundo Ct | Pleasanton | 1972 | 06/11/2026 | 2 | 1 | 903 | 0 | $500,000 | $496,000 | $549 | 0.99 | 67 | 67 |
| 8185 Arroyo Dr | Pleasanton | 1972 | 05/04/2026 | 2 | 1 | 810 | 0 | $515,000 | $510,000 | $630 | 0.99 | 73 | 66 |
| 2110 Arroyo Ct | Pleasanton | 1972 | 06/01/2026 | 2 | 1 | 810 | 0 | $498,000 | $485,000 | $599 | 0.97 | 46 | 65 |
| 2243 Segundo Ct | Pleasanton | 1972 | 05/21/2026 | 2 | 1 | 903 | 0 | $450,000 | $450,000 | $498 | 1.00 | 30 | 65 |
| Total: 5 · Average | 1.8 | 1.0 | 825.6 | 0 | $491,200 | $491,200 | $602 | — | 49.6 | ||||
| Median | 810 | $496,000 | $496,000 | ||||||||||
Market Analysis
List vs Sale $/SqFt
Sale Price Trend
Days on Market
Sale vs List Price
This analysis was generated automatically from MLS data. For an in-depth, human-reviewed valuation, contact Joseph Sardella at josephsardella@gmail.com.