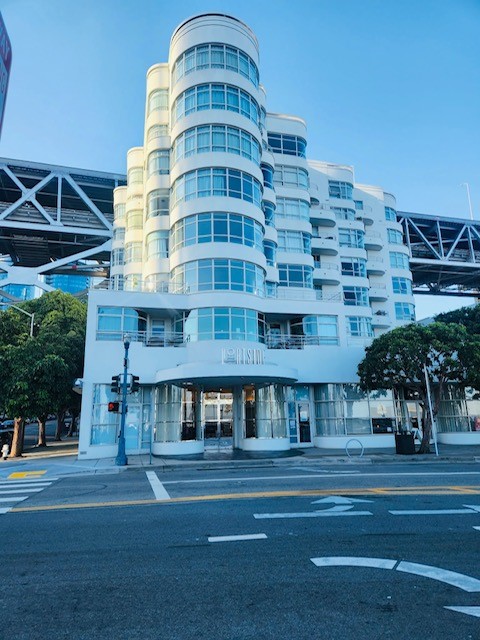
1 / 26
38 Bryant Street, 609, San Francisco, CA 94105
$1.05M1bd · 1ba · 945 sqft
Lot 32,017 sqft•HOA $1200/mo•Condominium•Active•35d on market•MLS# OC-26216301
38 Bryant Street, 609, San Francisco, CA 94105
MLS# OC-26216301•Residential•Condominium
Active35 days on market
$1,050,000
1
Beds
1
Baths
945
Sq Ft
32,017
Lot Sq Ft
$1,200
HOA/mo
1994
Year Built
Bridge(s), Ocean, Water
View
Property Description
Desirable San Francisco condo, 1 bedroom, 1 bath 945 sq ft located on the 6th floor with water and San Francisco/Oakland Bay Bridge view. This is a must see!!!
Features & Amenities
FeeBuilt 1994
Property Details
Land Type
Fee
Year Built
1994
Property Type
Residential
Property Subtype
Condominium
Parking Spaces
1
Garage Spaces
1
Cooling
None
View
Bridge(s), Ocean, Water
City
San Francisco
Zip Code
94105
County
San Francisco
Mortgage Calculator
Current Rates
$
$
%
Monthly Payment
$5,309.37
Principal & Interest
Loan Amount
$840,000
Total Interest
$1,071,374
Total Payment Over 30 Years
$1,911,374
This calculator provides estimates only. Actual mortgage payments may include taxes, insurance, HOA fees, and PMI. Contact a lender for accurate quotes.
Comparative Market Analysis
Affordable Tier · 3 active · 5 closed
38 Bryant Street, 609, San Francisco, CA 94105
San Francisco · Condominium
$1.05M
Affordable TierBeds
1
Baths
1
Sqft
945
Lot
32,017 sqft
Year
1994
$/Sqft
$1111
Pool: No✓
Spa: No✓
View: water✓
Garage: 1-car✓
Listed 11.7% above the median closed sale of $940,000. Closed comps sold at 102% of list — strong seller's market.
Price Position
Positioned above the market — commands a premium.
Premium
Subject listed at $1.05M· $1,111/sqft
Total list price
Closed comps
vs closed median $940K
+$110K (+11.7%)
Active comps
vs active median $1.05M
+$1K (+0.1%)
Price per sqft
Closed compsinsufficient comp data
Active comps
vs active avg $/sqft $960
+$151 (+15.7%)
Active Properties (3)
Active Comparables
| Address | City | Year | BD | BTH | SqFt | LotSz | LP/SqFt | LP | DIM | Score |
|---|---|---|---|---|---|---|---|---|---|---|
| 403 Main St | San Francisco | 1997 | 2 | 2 | 1,088 | 29,037 | $1,094 | $1.19M | 156 | 83 |
| 435 China Basin St | San Francisco | 2012 | 1 | 1 | 850 | 0 | $1,088 | $925,000 | 2 | 80 |
| 1200 Gough St | San Francisco | 1966 | 2 | 2 | 1,500 | 0 | $699 | $1.05M | 66 | 52 |
| Total: 3 · Average | 1.7 | 1.7 | 1,146 | 29,037 | $960.333 | $1.05M | 74.66666666666667 | |||
| Median | 1,088 | $1.05M | ||||||||
Closed Properties (5)
Closed Comparables
| Address | City | Year | Date | BD | BTH | SqFt | LotSz | LP | SP | SP/SqFt | SP/LP | DIM | Score |
|---|---|---|---|---|---|---|---|---|---|---|---|---|---|
| 333 Main Street | San Francisco | 2008 | 06/26/2026 | 1 | 1 | 828 | 76,210 | $938,000 | $938,000 | $1,133 | 1.00 | 45 | 81 |
| 318 Spear St | San Francisco | 2008 | 02/24/2026 | 1 | 1 | 836 | 76,210 | $995,000 | $940,000 | $1,124 | 0.94 | 31 | 79 |
| 318 Main ST | San Francisco | 2015 | 06/11/2026 | 1 | 2 | 1,104 | 0 | $1.13M | $1.08M | $978 | 0.96 | 66 | 79 |
| 170 King Street | San Francisco | 2007 | 05/14/2026 | 2 | 2 | 1,025 | 0 | $895,000 | $930,000 | $907 | 1.04 | 26 | 76 |
| 1160 Mission St | San Francisco | 2008 | 08/26/2026 | 2 | 2 | 1,146 | 43,000 | $989,000 | $1.16M | $1,009 | 1.17 | 27 | 67 |
| Total: 5 · Average | 1.4 | 1.6 | 987.8 | 65,140 | $1.01M | $1.01M | $1,030.2 | — | 39 | ||||
| Median | 1,025 | $940,000 | $940,000 | ||||||||||
Market Analysis
List vs Sale $/SqFt
Sale Price Trend
Days on Market
Sale vs List Price
AI-generated CMA
This analysis was generated automatically from MLS data. For an in-depth, human-reviewed valuation, contact Joseph Sardella at josephsardella@gmail.com.