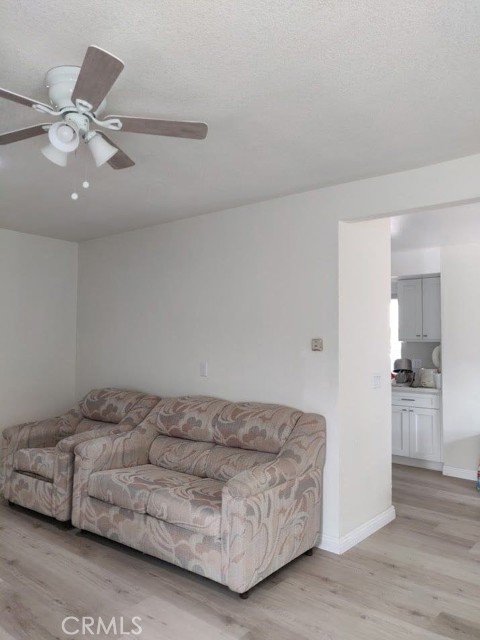
3689 Ahern Drive, Baldwin Park, CA 91706
3689 Ahern Drive, Baldwin Park, CA 91706
Property Description
Motived Seller for this charming home. Great location in center Baldwin Park with convenient to Wall-Mart shopping, school , public transportation and easy access freeway, a wonderful opportunity to enjoy spacious living, with producing fruit trees add a delicious bonus picking fruit from your own backyard. This home present a fantastic opportunity for homeowners and investors alike.
Features & Amenities
Property Details
Mortgage Calculator
Current Rates
Comparative Market Analysis
Affordable Tier · 5 active · 5 closed
Baldwin Park · Single Family Residence
Listed 4.0% above the median closed sale of $701,000. Price per sqft ($671) is a 25% premium to closed comps ($537).
Price Position
Aligned with the market — fair pricing for the comps.
Active Properties (5)
Active Comparables
| Address | City | Year | BD | BTH | SqFt | LotSz | LP/SqFt | LP | DIM | Score |
|---|---|---|---|---|---|---|---|---|---|---|
| 14813 Jeremie | Baldwin Park | 1959 | 4 | 2 | 1,294 | 5,205 | $580 | $750,000 | 7 | 87 |
| 14636 Demblon | Baldwin Park | 1960 | 3 | 2 | 1,256 | 5,795 | $557 | $699,000 | 106 | 85 |
| 14457 Bresee | Baldwin Park | 1961 | 3 | 2 | 1,352 | 5,451 | $581 | $785,000 | 120 | 85 |
| 4458 Stewart Avenue | Baldwin Park | 1940 | 3 | 2 | 1,174 | 6,805 | $554 | $650,000 | 127 | 80 |
| 4114 Benham | Baldwin Park | 1950 | 2 | 1 | 864 | 6,096 | $867 | $749,000 | 2 | 79 |
| Total: 5 · Average | 3.0 | 1.8 | 1,188 | 5,870.4 | $627.8 | $726,600 | 72.4 | |||
| Median | 1,256 | $749,000 | ||||||||
Closed Properties (5)
Closed Comparables
| Address | City | Year | Date | BD | BTH | SqFt | LotSz | LP | SP | SP/SqFt | SP/LP | DIM | Score |
|---|---|---|---|---|---|---|---|---|---|---|---|---|---|
| 14657 Channing Street | Baldwin Park | 1958 | 09/04/2026 | 3 | 2 | 1,276 | 5,174 | $700,000 | $707,000 | $554 | 1.01 | 52 | 89 |
| 3933 Vineland | Baldwin Park | 1947 | 07/02/2026 | 3 | 1 | 1,118 | 6,571 | $680,000 | $665,000 | $595 | 0.98 | 28 | 84 |
| 3530 Van Wig | Baldwin Park | 1961 | 10/19/2026 | 4 | 2 | 1,629 | 4,683 | $749,990 | $750,000 | $460 | 1.00 | 69 | 79 |
| 3506 Puente | Baldwin Park | 1948 | 04/28/2026 | 2 | 1 | 1,040 | 7,899 | $675,000 | $635,000 | $611 | 0.94 | 101 | 79 |
| 3451 Van Wig Avenue | Baldwin Park | 1979 | 06/01/2026 | 3 | 2 | 1,505 | 6,227 | $699,000 | $701,000 | $466 | 1.00 | 52 | 77 |
| Total: 5 · Average | 3.0 | 1.6 | 1,313.6 | 6,110.8 | $691,600 | $691,600 | $537.2 | — | 60.4 | ||||
| Median | 1,276 | $701,000 | $701,000 | ||||||||||
Market Analysis
List vs Sale $/SqFt
Sale Price Trend
Days on Market
Sale vs List Price
This analysis was generated automatically from MLS data. For an in-depth, human-reviewed valuation, contact Joseph Sardella at josephsardella@gmail.com.