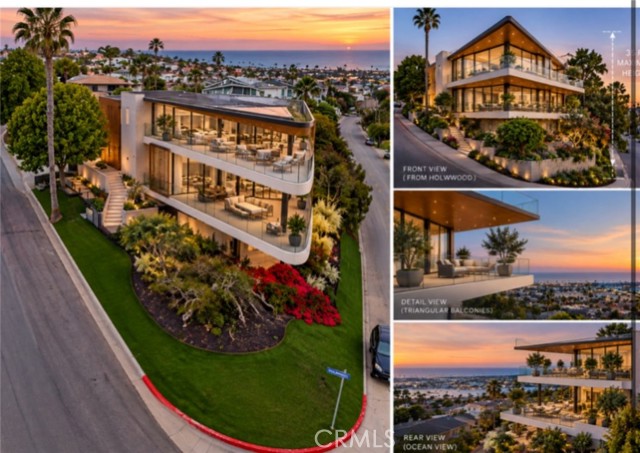
300 Holmwood Drive, Newport Beach, CA 92663
300 Holmwood Drive, Newport Beach, CA 92663
Property Description
Unique privacy offered by its corner lot and hillside location. Ocean view: you can see the Pacific Ocean and Newport Harbor from the comfort of your home. There is nothing like this one of a kind estate - you will need to see to believe!
Features & Amenities
Property Details
Mortgage Calculator
Current Rates
About Newport Heights
This property is located in Newport Heights, a community in Newport Beach. Explore more listings in this neighborhood to compare options and pricing.
View Newport Heights ListingsComparative Market Analysis
Luxury Tier · 5 active · 5 closed
Newport Heights · Newport Beach · Single Family Residence
Listed 5.1% below the median closed sale of $3,900,000. Price per sqft ($2,333) is a 36% premium to closed comps ($1,712). Closed comps sold at 94% of list — buyers have negotiating leverage. Luxury tier — fewer comparable sales widen the confidence range.
Price Position
Priced below the market — value advantage over the field.
Active Properties (5)
Active Comparables
| Address | City | Year | BD | BTH | SqFt | LotSz | LP/SqFt | LP | DIM | Score |
|---|---|---|---|---|---|---|---|---|---|---|
| 215 Ocean View | Newport Beach | 1964 | 3 | 2 | 2,264 | 11,400 | $1,634 | $3.70M | 79 | 73 |
| 2001 Haven | Newport Beach | 2001 | 4 | 4 | 2,789 | 3,602 | $1,146 | $3.19M | 15 | 63 |
| 288 Bay Street | Costa Mesa | 1958 | 4 | 4 | 2,429 | 6,000 | $1,315 | $3.19M | 38 | 47 |
| 317 Walnut Street | Costa Mesa | 1957 | 4 | 3 | 2,294 | 8,046 | $1,656 | $3.80M | 25 | 44 |
| 228 Costa Mesa Street | Costa Mesa | 2026 | 4 | 5 | 3,502 | 7,533 | $1,141 | $4.00M | 61 | 42 |
| Total: 5 · Average | 3.8 | 3.6 | 2,655.6 | 7,316.2 | $1,378.4 | $3.58M | 43.6 | |||
| Median | 2,429 | $3.70M | ||||||||
Closed Properties (5)
Closed Comparables
| Address | City | Year | Date | BD | BTH | SqFt | LotSz | LP | SP | SP/SqFt | SP/LP | DIM | Score |
|---|---|---|---|---|---|---|---|---|---|---|---|---|---|
| 415 San Bernardino | Newport Beach | 1941 | 02/17/2026 | 2 | 2 | 1,599 | 5,781 | $3.60M | $3.90M | $2,439 | 1.08 | 32 | 82 |
| 231 Santa Ana | Newport Beach | 1952 | 12/09/2025 | 2 | 2 | 1,685 | 4,601 | $3.40M | $3.40M | $2,015 | 1.00 | 0 | 80 |
| 332 Holmwood Drive | Newport Beach | 1994 | 07/20/2026 | 3 | 3 | 3,520 | 5,888 | $4.13M | $3.72M | $1,057 | 0.90 | 71 | 79 |
| 2700 Cliff | Newport Beach | 1941 | 09/04/2026 | 2 | 2 | 2,369 | 6,875 | $5.00M | $4.05M | $1,710 | 0.81 | 77 | 78 |
| 425 Tustin Avenue | Newport Beach | 1953 | 06/25/2026 | 5 | 4 | 3,002 | 6,373 | $4.39M | $4.03M | $1,341 | 0.92 | 149 | 68 |
| Total: 5 · Average | 2.8 | 2.6 | 2,435 | 5,903.6 | $3.82M | $3.82M | $1,712.4 | — | 65.8 | ||||
| Median | 2,369 | $3.90M | $3.90M | ||||||||||
Market Analysis
List vs Sale $/SqFt
Sale Price Trend
Days on Market
Sale vs List Price
This analysis was generated automatically from MLS data. For an in-depth, human-reviewed valuation, contact Joseph Sardella at josephsardella@gmail.com.