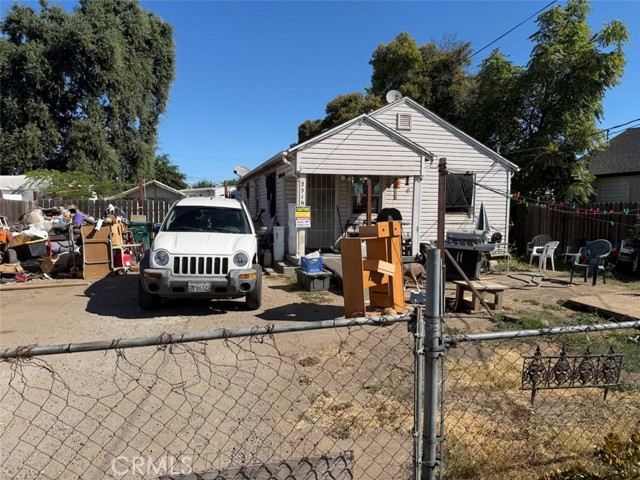
1 / 1
2519 E Lindsay Street, Stockton, CA 95205
$300K2bd · 1ba · 732 sqft
Lot 5,900 sqft•Single Family Residence•Active•91d on market•MLS# OC-26182149
2519 E Lindsay Street, Stockton, CA 95205
MLS# OC-26182149•Residential•Single Family Residence
Active91 days on market
$300,000
2
Beds
1
Baths
732
Sq Ft
5,900
Lot Sq Ft
1954
Year Built
None
View
Property Description
2 bed, 1 bath single family sold as-is. Property needs a lot of work. Good opportunity for an experienced Buyer.
Features & Amenities
FeeBuilt 1954
Property Details
Land Type
Fee
Year Built
1954
Property Type
Residential
Property Subtype
Single Family Residence
Parking Spaces
1
Garage Spaces
1
Cooling
Wall/Window Unit(s)
View
None
City
Stockton
Zip Code
95205
County
San Joaquin
Mortgage Calculator
Current Rates
$
$
%
Monthly Payment
$1,516.96
Principal & Interest
Loan Amount
$240,000
Total Interest
$306,107
Total Payment Over 30 Years
$546,107
This calculator provides estimates only. Actual mortgage payments may include taxes, insurance, HOA fees, and PMI. Contact a lender for accurate quotes.
Comparative Market Analysis
Affordable Tier · 3 active · 5 closed
2519 E Lindsay Street, Stockton, CA 95205
Stockton · Single Family Residence
$300K
Affordable TierBeds
2
Baths
1
Sqft
732
Lot
5,900 sqft
Year
1954
$/Sqft
$410
Pool: No✓
View: None✓
Garage: 1-car✓
Listed in line with the median closed sale of $295,000. Price per sqft ($410) is a 32% premium to closed comps ($311). Closed comps sold at 101% of list — strong seller's market.
Price Position
Aligned with the market — fair pricing for the comps.
At market
Subject listed at $300K· $410/sqft
Total list price
Closed comps
vs closed median $295K
+$5K (+1.7%)
Active comps
vs active median $257K
+$43K (+16.6%)
Price per sqft
Closed compsinsufficient comp data
Active comps
vs active avg $/sqft $274
+$136 (+49.8%)
Active Properties (3)
Active Comparables
| Address | City | Year | BD | BTH | SqFt | LotSz | LP/SqFt | LP | DIM | Score |
|---|---|---|---|---|---|---|---|---|---|---|
| 5103 Elvin | Stockton | 1947 | 2 | 1 | 912 | 5,750 | $373 | $339,900 | 26 | 79 |
| 2411 Ophir | Stockton | 1947 | 2 | 1 | 1,320 | 5,050 | $194 | $256,258 | 59 | 53 |
| 2820 El Dorado Street | Stockton | 1927 | 2 | 1 | 1,012 | 3,625 | $254 | $257,300 | 667 | 47 |
| Total: 3 · Average | 2.0 | 1.0 | 1,081.333 | 4,808.333 | $273.667 | $284,486 | 250.66666666666666 | |||
| Median | 1,012 | $257,300 | ||||||||
Closed Properties (5)
Closed Comparables
| Address | City | Year | Date | BD | BTH | SqFt | LotSz | LP | SP | SP/SqFt | SP/LP | DIM | Score |
|---|---|---|---|---|---|---|---|---|---|---|---|---|---|
| 627 Gratton Ave | Stockton | 1930 | 07/17/2026 | 2 | 1 | 816 | 5,426 | $275,000 | $275,000 | $337 | 1.00 | 30 | 80 |
| 2353 Robindale Ave | Stockton | 1940 | 07/21/2026 | 2 | 1 | 836 | 5,000 | $299,500 | $300,000 | $359 | 1.00 | 81 | 74 |
| 3704 San Rafael | Stockton | 1953 | 05/08/2026 | 2 | 1 | 860 | 7,500 | $285,000 | $295,000 | $343 | 1.03 | 31 | 73 |
| 1402 Morrison Ave | Stockton | 1977 | 08/07/2026 | 3 | 1 | 1,110 | 6,303 | $280,000 | $280,000 | $252 | 1.00 | 111 | 67 |
| 1412 Morrison Ave | Stockton | 1977 | 07/14/2026 | 3 | 2 | 1,110 | 9,800 | $295,000 | $295,000 | $266 | 1.00 | 88 | 61 |
| Total: 5 · Average | 2.4 | 1.2 | 946.4 | 6,805.8 | $289,000 | $289,000 | $311.4 | — | 68.2 | ||||
| Median | 860 | $295,000 | $295,000 | ||||||||||
Market Analysis
List vs Sale $/SqFt
Sale Price Trend
Days on Market
Sale vs List Price
AI-generated CMA
This analysis was generated automatically from MLS data. For an in-depth, human-reviewed valuation, contact Joseph Sardella at josephsardella@gmail.com.