1 / 18
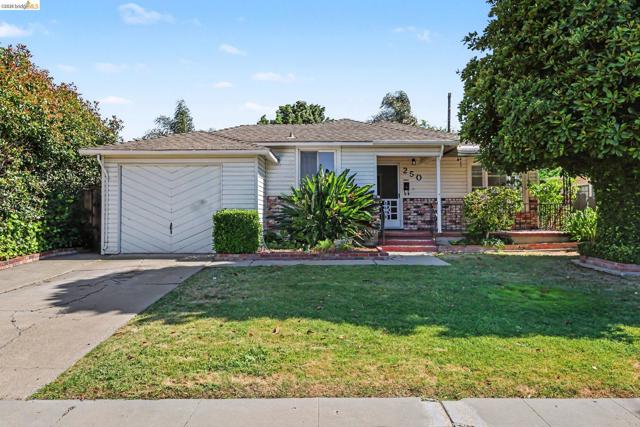
250 West 23Rd St, Tracy, CA 95376
$450K3bd · 1ba · 1,031 sqft
Lot 5,238 sqft•Single Family Residence•Active•11d on market•MLS# 00-41153334
250 West 23Rd St, Tracy, CA 95376
MLS# 00-41153334•Residential•Single Family Residence
Active11 days on market
$450,000
3
Beds
1
Baths
1,031
Sq Ft
5,238
Lot Sq Ft
1948
Year Built
Property Description
Cute bungalow close to downtown. Three bedrooms and one bath with new flooring, interior paint and shower door. Large lot with landscaped backyard and shed. Close to shopping, schools and commute routes.
Features & Amenities
FeeBuilt 1948
Property Details
Land Type
Fee
Year Built
1948
Property Type
Residential
Property Subtype
Single Family Residence
Heating
Forced Air
Cooling
Central Air
Roof
Shingle
City
Tracy
Zip Code
95376
County
San Joaquin
Mortgage Calculator
Current Rates
$
$
%
Monthly Payment
$2,275.44
Principal & Interest
Loan Amount
$360,000
Total Interest
$459,160
Total Payment Over 30 Years
$819,160
This calculator provides estimates only. Actual mortgage payments may include taxes, insurance, HOA fees, and PMI. Contact a lender for accurate quotes.
Comparative Market Analysis
Affordable Tier · 1 active · 5 closed
250 West 23Rd St, Tracy, CA 95376
Tracy · Single Family Residence
$450K
Affordable TierBeds
3
Baths
1
Sqft
1,031
Lot
5,238 sqft
Year
1948
$/Sqft
$436
Pool: No✓
Listed in line with the median closed sale of $460,000. Closed comps sold at 100% of list — strong seller's market.
Price Position
Aligned with the market — fair pricing for the comps.
At market
Subject listed at $450K· $436/sqft
Total list price
Closed comps
vs closed median $460K
−$10K (−2.2%)
Active comps
vs active median $509K
−$59K (−11.6%)
Price per sqft
Closed compsinsufficient comp data
Active comps
vs active avg $/sqft $454
−$18 (−4.0%)
Active Properties (1)
Active Comparables
| Address | City | Year | BD | BTH | SqFt | LotSz | LP/SqFt | LP | DIM | Score |
|---|---|---|---|---|---|---|---|---|---|---|
| 111 23 Rd Street | Tracy | 1959 | 3 | 2 | 1,120 | 5,671 | $454 | $509,000 | 101 | 87 |
| Total: 1 · Average | 3.0 | 2.0 | 1,120 | 5,671 | $454 | $509,000 | 101 | |||
| Median | 1,120 | $509,000 | ||||||||
Closed Properties (5)
Closed Comparables
| Address | City | Year | Date | BD | BTH | SqFt | LotSz | LP | SP | SP/SqFt | SP/LP | DIM | Score |
|---|---|---|---|---|---|---|---|---|---|---|---|---|---|
| 1823 Wall St. | Tracy | 1954 | 05/08/2026 | 3 | 1 | 1,080 | 5,000 | $479,000 | $464,000 | $430 | 0.97 | 114 | 90 |
| 445 Lowell Ave | Tracy | 1927 | 08/28/2026 | 2 | 1 | 1,042 | 5,250 | $410,000 | $420,000 | $403 | 1.02 | 59 | 85 |
| 2448 Altoga Ave | Tracy | 1954 | 08/04/2026 | 2 | 1 | 949 | 8,968 | $449,000 | $460,000 | $485 | 1.02 | 38 | 85 |
| 239 20th | Tracy | 1955 | 01/27/2026 | 3 | 2 | 1,073 | 6,534 | $459,000 | $455,000 | $424 | 0.99 | 71 | 80 |
| 1225 Beverly Pl | Tracy | 1959 | 08/05/2026 | 3 | 2 | 1,150 | 5,665 | $499,000 | $500,000 | $435 | 1.00 | 104 | 79 |
| Total: 5 · Average | 2.6 | 1.4 | 1,058.8 | 6,283.4 | $459,800 | $459,800 | $435.4 | — | 77.2 | ||||
| Median | 1,073 | $460,000 | $460,000 | ||||||||||
Market Analysis
List vs Sale $/SqFt
Sale Price Trend
Days on Market
Sale vs List Price
AI-generated CMA
This analysis was generated automatically from MLS data. For an in-depth, human-reviewed valuation, contact Joseph Sardella at josephsardella@gmail.com.