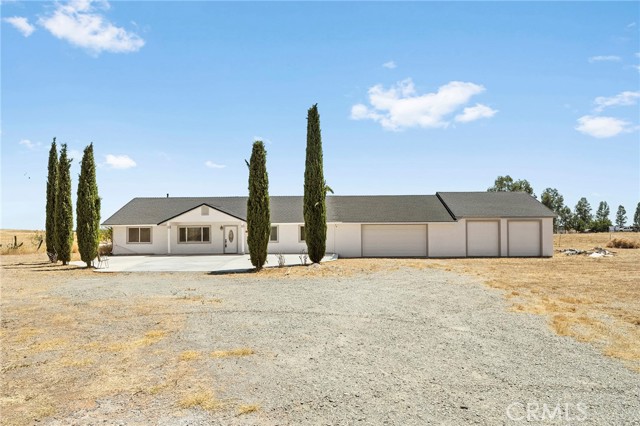
24661 Rowland Ln, Corning, CA 96021
24661 Rowland Ln, Corning, CA 96021
Property Description
Here is your updated listing with owned solar included: Discover the perfect blend of space, comfort, and country living with this beautifully maintained 4-bedroom, 2-bath home on 10 acres in scenic Tehama County. Built in 2006 and in like-new condition, this property offers modern construction with the tranquility of wide-open land—plus the added benefit of owned solar for energy efficiency and long-term savings. The spacious layout features generous living areas, a functional floor plan, and plenty of natural light throughout. The well-appointed kitchen flows seamlessly into the main living space, making it ideal for both everyday living and entertaining. Outside, the possibilities are endless. With 10 usable acres, there is ample room for animals, recreation, or future improvements. The oversized 4-car garage provides abundant space for vehicles, equipment, or a workshop. Whether you are seeking a private retreat, a working property, or simply room to grow, this Tehama County gem delivers space, versatility, and move-in-ready comfort.
Features & Amenities
Property Details
Mortgage Calculator
Current Rates
Comparative Market Analysis
Residential Tier · 0 active · 3 closed
Corning · Single Family Residence
Listed 14.4% above the median closed sale of $445,000. Expect a longer timeline — comps averaged 219 days on market.
Price Position
Positioned above the market — commands a premium.
Closed Properties (3)
Closed Comparables
| Address | City | Year | Date | BD | BTH | SqFt | LotSz | LP | SP | SP/SqFt | SP/LP | DIM | Score |
|---|---|---|---|---|---|---|---|---|---|---|---|---|---|
| 3770 Hall Rd | Corning | 2006 | 08/19/2026 | 3 | 2 | 2,062 | 366,775 | $450,000 | $435,000 | $211 | 0.97 | 134 | 65 |
| 1800 Inghram Rd | Corning | 2006 | 09/09/2026 | 3 | 2 | 2,125 | 76,230 | $549,900 | $550,000 | $259 | 1.00 | 34 | 52 |
| 24751 South Avenue | Corning | 1966 | 04/25/2025 | 2 | 1 | 1,248 | 844,193 | $449,000 | $445,000 | $357 | 0.99 | 490 | 36 |
| Total: 3 · Average | 2.7 | 1.7 | 1,811.667 | 429,066 | $476,666.667 | $476,666.667 | $275.667 | — | 219.33333333333334 | ||||
| Median | 2,062 | $445,000 | $445,000 | ||||||||||
Market Analysis
List vs Sale $/SqFt
Sale Price Trend
Days on Market
Sale vs List Price
This analysis was generated automatically from MLS data. For an in-depth, human-reviewed valuation, contact Joseph Sardella at josephsardella@gmail.com.