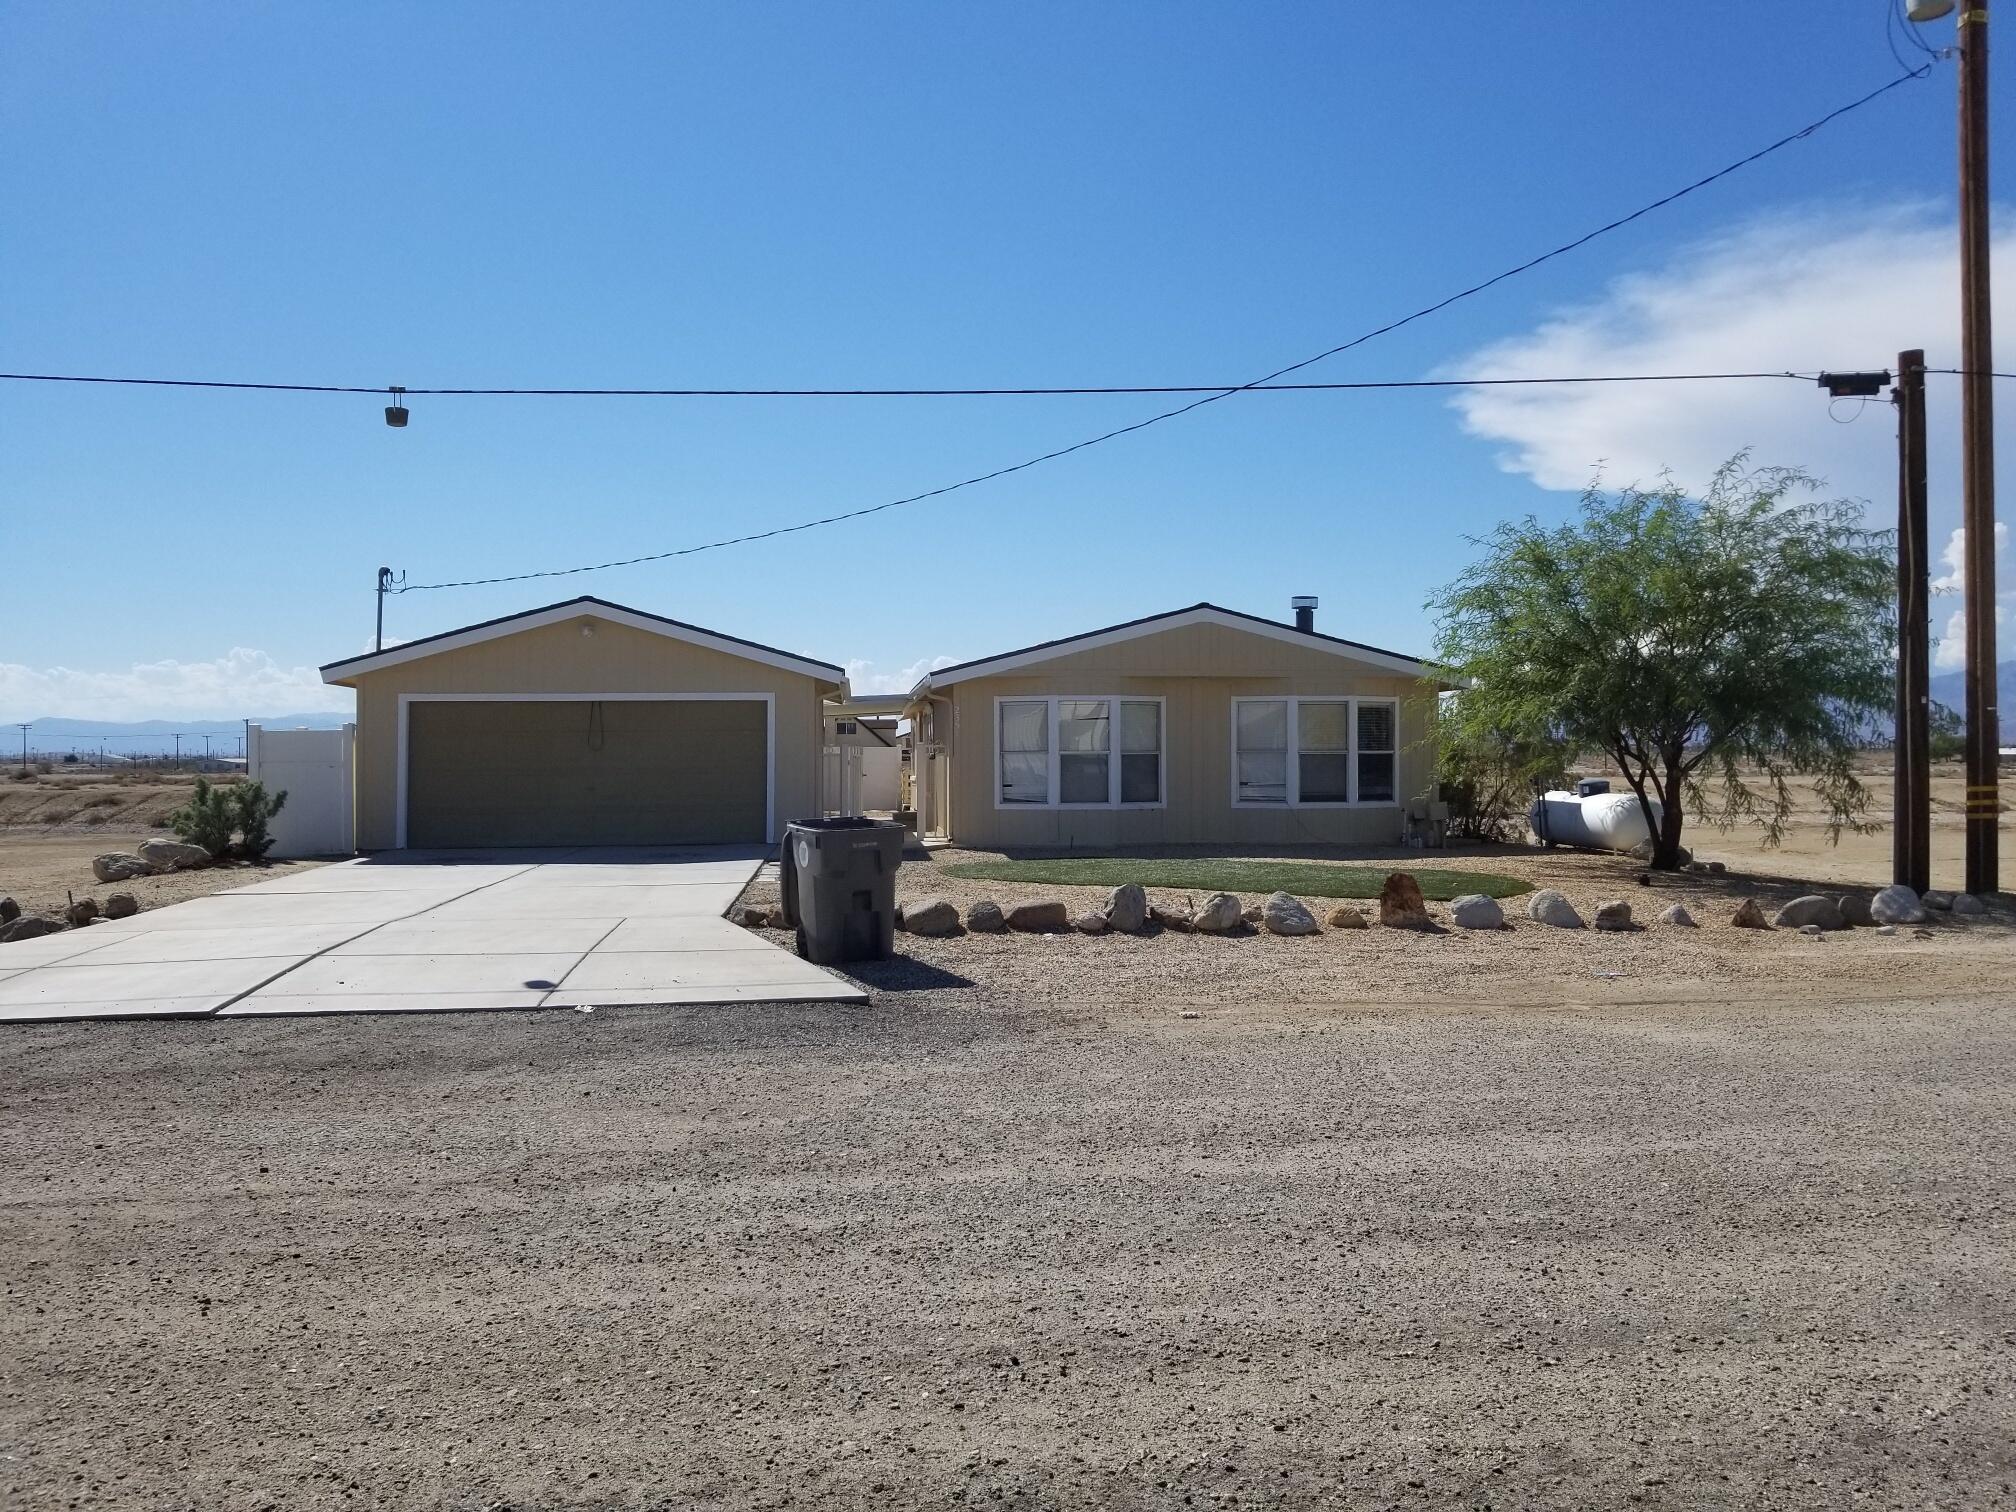
2351 Lanai Lane, Salton City, CA 92275
2351 Lanai Lane, Salton City, CA 92275
Property Description
Salton City, Ca. 2351 Lanai Lane. Seller willing to finance. Very nice 3 Bedroom, 2 Bath, 2 Car detached Garage. Open concept kitchen, dining and living room, Fireplace. Curb appeal, Features: private vinyl fencing. Wrought Iron entry gate, Newer roof, Newer appliances. Located on the canal/fingers (currently dry). Home is on permanent foundation. (433A). Laminate Wood Floors thru out, Close to schools, local shopping, gas, Red Earth Casino, area restaurants. Area very popular in the winter because of gorgeous weather. You own the land, No HOA's, lower IID electric in this area. Seller willing to do seller financing. Seller and/or agent make no warranties. Property sold 'AS-IS. Very clean and ready for financing. More pictures to be posted today.
Features & Amenities
Property Details
Mortgage Calculator
Current Rates
About Truckhaven
This property is located in Truckhaven, a community in Salton City. Explore more listings in this neighborhood to compare options and pricing.
View Truckhaven ListingsComparative Market Analysis
Affordable Tier · 5 active · 5 closed
Truckhaven · Salton City · Single Family Residence
Listed in line with the median closed sale of $255,000. Price per sqft ($180) is a 15% discount to closed comps ($212). Expect a longer timeline — comps averaged 156 days on market.
Price Position
Aligned with the market — fair pricing for the comps.
Active Properties (5)
Active Comparables
| Address | City | Year | BD | BTH | SqFt | LotSz | LP/SqFt | LP | DIM | Score |
|---|---|---|---|---|---|---|---|---|---|---|
| 783 Molokai | Thermal | 1987 | 3 | 2 | 1,467 | 10,001 | $181 | $264,999 | 41 | 85 |
| 786 Molokai Avenue | Thermal | 1985 | 4 | 2 | 1,372 | 9,998 | $200 | $274,900 | 140 | 79 |
| 2351 Oahu Lane | Salton City | 1980 | 3 | 2 | 2,234 | 15,719 | $123 | $275,000 | 125 | 78 |
| 944 Flamingo Avenue | Salton City | 1976 | 3 | 2 | 1,600 | 34,848 | $172 | $274,900 | 34 | 76 |
| 2367 Oahu Lane | Thermal | 1972 | 4 | 2 | 1,744 | 11,069 | $135 | $234,900 | 176 | 74 |
| Total: 5 · Average | 3.4 | 2.0 | 1,683.4 | 16,327 | $162.2 | $264,939.8 | 103.2 | |||
| Median | 1,600 | $274,900 | ||||||||
Closed Properties (5)
Closed Comparables
| Address | City | Year | Date | BD | BTH | SqFt | LotSz | LP | SP | SP/SqFt | SP/LP | DIM | Score |
|---|---|---|---|---|---|---|---|---|---|---|---|---|---|
| 2469 Shore Life Avenue | Thermal | 2005 | 10/15/2026 | 3 | 2 | 1,295 | 10,052 | $265,000 | $255,000 | $197 | 0.96 | 34 | 67 |
| 1064 Treasure Drive | Thermal | 1992 | 06/15/2026 | 3 | 2 | 1,300 | 10,888 | $279,000 | $289,000 | $222 | 1.04 | 61 | 66 |
| 2342 Sand Jewel Avenue | Thermal | 1988 | 11/25/2025 | 3 | 2 | 1,300 | 10,101 | $249,000 | $245,000 | $188 | 0.98 | 280 | 64 |
| 2334 Marlin Drive | Thermal | 2006 | 04/28/2026 | 3 | 2 | 1,232 | 10,616 | $315,000 | $295,000 | $239 | 0.94 | 265 | 64 |
| 2327 Brentwood Avenue | Thermal | 1987 | 10/06/2026 | 3 | 2 | 1,152 | 11,169 | $249,000 | $249,000 | $216 | 1.00 | 139 | 63 |
| Total: 5 · Average | 3.0 | 2.0 | 1,255.8 | 10,565.2 | $266,600 | $266,600 | $212.4 | — | 155.8 | ||||
| Median | 1,295 | $255,000 | $255,000 | ||||||||||
Market Analysis
List vs Sale $/SqFt
Sale Price Trend
Days on Market
Sale vs List Price
This analysis was generated automatically from MLS data. For an in-depth, human-reviewed valuation, contact Joseph Sardella at josephsardella@gmail.com.