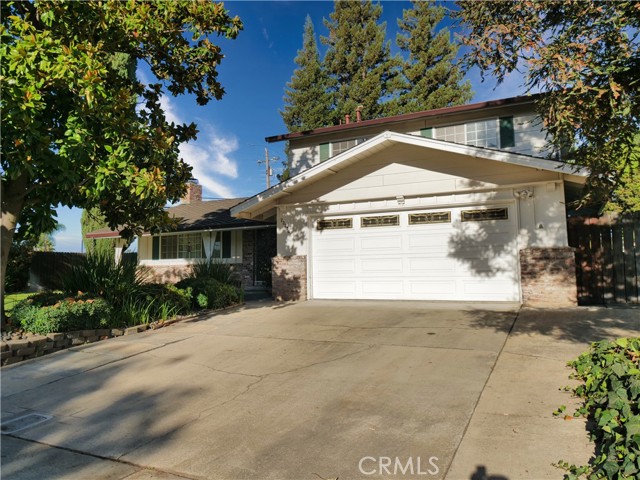
23276 cypress point, Ripon, CA 95366
23276 cypress point, Ripon, CA 95366
Property Description
A quarter-acre lot inside Spring Creek Estates, two minutes from the clubhouse and an eight-minute walk if you'd rather stroll. The kitchen has expansive storage and a dining nook that looks out over the backyard where a deep pool anchors a yard with real room to spread out. The home has 3 bedrooms and 3 baths with a primary suite on each floor. The upstairs suite opens onto a deck overlooking the whole backyard. Add a large, open front yard and you've got a home that lives as well as it looks. Take a swing at the Spring Creek lifestyle.
Features & Amenities
Property Details
Mortgage Calculator
Current Rates
Comparative Market Analysis
Residential Tier · 1 active · 2 closed
Ripon · Single Family Residence
Listed in line with the median closed sale of $665,000. Price per sqft ($379) is a 42% premium to closed comps ($267). Closed comps sold at 103% of list — strong seller's market.
Price Position
Priced below the market — value advantage over the field.
Active Properties (1)
Active Comparables
| Address | City | Year | BD | BTH | SqFt | LotSz | LP/SqFt | LP | DIM | Score |
|---|---|---|---|---|---|---|---|---|---|---|
| 4529 Sun Ray | Salida | 1996 | 4 | 3 | 2,520 | 6,000 | $232 | $585,000 | 102 | 57 |
| Total: 1 · Average | 4.0 | 3.0 | 2,520 | 6,000 | $232 | $585,000 | 102 | |||
| Median | 2,520 | $585,000 | ||||||||
Closed Properties (2)
Closed Comparables
| Address | City | Year | Date | BD | BTH | SqFt | LotSz | LP | SP | SP/SqFt | SP/LP | DIM | Score |
|---|---|---|---|---|---|---|---|---|---|---|---|---|---|
| 4921 Sun Brook Drive | Salida | 1994 | 06/16/2026 | 4 | 3 | 1,769 | 8,660 | $550,000 | $580,000 | $328 | 1.05 | 31 | 69 |
| 663 Clay Way | Ripon | 2000 | 07/06/2026 | 5 | 4 | 3,648 | 7,296 | $745,000 | $750,000 | $206 | 1.01 | 31 | 38 |
| Total: 2 · Average | 4.5 | 3.5 | 2,708.5 | 7,978 | $665,000 | $665,000 | $267 | — | 31 | ||||
| Median | 3,648 | $750,000 | $750,000 | ||||||||||
Market Analysis
List vs Sale $/SqFt
Sale Price Trend
Days on Market
Sale vs List Price
This analysis was generated automatically from MLS data. For an in-depth, human-reviewed valuation, contact Joseph Sardella at josephsardella@gmail.com.