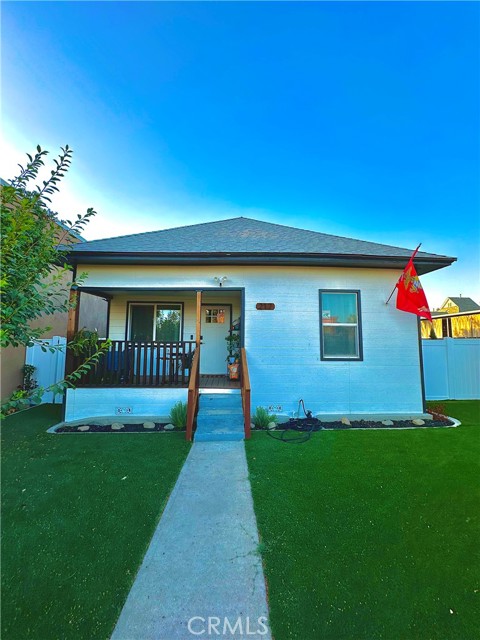
217 East Stuart, Redlands, CA 92374
217 East Stuart, Redlands, CA 92374
Property Description
THIS REDLANDS HOME IS IN A PRIME LOCATION AND A GREAT LOCATION FOR LIVING OR FOR A BUSINESS, SITUATED JUST ONE BLOCK OF HISTORIC DOWNTOWN REDLANDS, WALKING DISTANCE TO VON'S GROCERY STORE, TRADER JOE'S AND MANY OTHERS EATERIES AND BANKS AND ALL AMENITIES OF LIVING IN A CITY.THERE IS TWO ENTRANCES FOR THE PROPERTY, ONE THROUGH THE BACK ALLEY AND THE OTHER AT THE FRONT GATE. THIS HOME HAS RV PARKING IN THE BACKYARD WITH PLENTY OF TOOM FOR YOUR RV, BOATS OR ANY OTHER TOYS. NEARBY ACCES TO FWY 10 ALSO TO THE REDLANDS PASSENGER TRAIN TO THE SAN BERNARDINO SANTA FE RAILROAD STATION. THE PROEPRTY MAY USED AS BUSINESS AS YOU LIKE, THE HOUSE WAS COMPLETELY REMODELED INSIDE OUT BUT KEPT THE OLD FACADE STYLE IN THE FRONT. THERE IS METAL GATE IN THE BACK WITH ENOUGH SPACE TO ENTER AND A LARGE STORAGE CASITA PLUS A WELL KEPT GARDEN IN THE FRONT AND THE BACK.
Features & Amenities
Property Details
Mortgage Calculator
Current Rates
Comparative Market Analysis
Affordable Tier · 5 active · 5 closed
Redlands · Single Family Residence
Listed 4.7% above the median closed sale of $645,000. Price per sqft ($562) is a 16% premium to closed comps ($485). Closed comps sold at 100% of list — strong seller's market.
Price Position
Aligned with the market — fair pricing for the comps.
Active Properties (5)
Active Comparables
| Address | City | Year | BD | BTH | SqFt | LotSz | LP/SqFt | LP | DIM | Score |
|---|---|---|---|---|---|---|---|---|---|---|
| 1018 6th | Redlands | 1900 | 4 | 3 | 1,292 | 6,419 | $463 | $598,000 | 30 | 81 |
| 618 Cypress Circle | Redlands | 1922 | 3 | 1 | 1,563 | 5,406 | $393 | $614,500 | 15 | 71 |
| 108 Buena Vista | Redlands | 1901 | 4 | 2 | 1,892 | 6,950 | $304 | $575,000 | 96 | 71 |
| 519 Alvarado | Redlands | 1910 | 3 | 2 | 1,726 | 13,048 | $397 | $685,000 | 2 | 71 |
| 1224 6th | Redlands | 1958 | 4 | 3 | 1,662 | 6,550 | $408 | $678,000 | 18 | 67 |
| Total: 5 · Average | 3.6 | 2.2 | 1,627 | 7,674.6 | $393 | $630,100 | 32.2 | |||
| Median | 1,662 | $614,500 | ||||||||
Closed Properties (5)
Closed Comparables
| Address | City | Year | Date | BD | BTH | SqFt | LotSz | LP | SP | SP/SqFt | SP/LP | DIM | Score |
|---|---|---|---|---|---|---|---|---|---|---|---|---|---|
| 1107 Orange | Redlands | 1910 | 10/22/2026 | 3 | 1 | 1,317 | 6,615 | $575,000 | $575,000 | $437 | 1.00 | 113 | 84 |
| 517 4th Street | Redlands | 1912 | 11/04/2026 | 3 | 2 | 1,299 | 8,000 | $730,000 | $730,000 | $562 | 1.00 | 49 | 80 |
| 323 Colton | Redlands | 1891 | 07/14/2026 | 3 | 2 | 1,536 | 5,652 | $599,000 | $585,000 | $381 | 0.98 | 151 | 79 |
| 234 Grant | Redlands | 1901 | 07/06/2026 | 4 | 2 | 1,275 | 7,000 | $684,000 | $705,000 | $553 | 1.03 | 25 | 78 |
| 74 N Buena Vista | Redlands | 1950 | 06/15/2026 | 3 | 2 | 1,311 | 6,490 | $635,000 | $645,000 | $492 | 1.02 | 81 | 77 |
| Total: 5 · Average | 3.2 | 1.8 | 1,347.6 | 6,751.4 | $648,000 | $648,000 | $485 | — | 83.8 | ||||
| Median | 1,311 | $645,000 | $645,000 | ||||||||||
Market Analysis
List vs Sale $/SqFt
Sale Price Trend
Days on Market
Sale vs List Price
This analysis was generated automatically from MLS data. For an in-depth, human-reviewed valuation, contact Joseph Sardella at josephsardella@gmail.com.