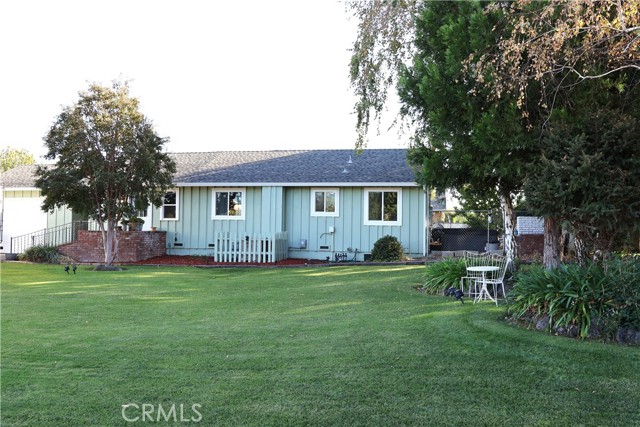
217 Carona Ave., Corning, CA 96021
217 Carona Ave., Corning, CA 96021
Property Description
Welcome to this Charming home located in a great quiet neighborhood. This beautiful home sits on almost 1/2 an acre of land with perfectly manicured front lawn for family picnics and BBQs. This beautiful home has new double pane windows recently installed. The Remodeled bathrooms are picture perfect. Let's focus on the best part of the home, the KITCHEN!!!! New flooring, New matching appliances, new countertops, and new sink. An entertainers dream come true. Imagine hosting family gatherings and Holiday Parties. Open concept makes it very functional. A sliding door leads you to a spacious backyard that's fully fenced. The backyard has privacy and a newer hot tub awaits you. Pet friendly home for the fur babies to roam around. Spacious garage for your storage needs. Leased solar. Walking distance to elementary, middle and high school. Local clinic is minutes away. Grocery shopping and downtown are minutes away. This home is perfect to raise a family and make memories that will last a lifetime. Schedule a showing today.
Features & Amenities
Property Details
Mortgage Calculator
Current Rates
Comparative Market Analysis
Affordable Tier · 5 active · 5 closed
Corning · Single Family Residence
Listed in line with the median closed sale of $400,000. Price per sqft ($297) is a 13% premium to closed comps ($262).
Price Position
Aligned with the market — fair pricing for the comps.
Active Properties (5)
Active Comparables
| Address | City | Year | BD | BTH | SqFt | LotSz | LP/SqFt | LP | DIM | Score |
|---|---|---|---|---|---|---|---|---|---|---|
| 1221 Pear | Corning | 1954 | 3 | 2 | 1,156 | 10,528 | $320 | $370,000 | 81 | 85 |
| 1216 Pear | Corning | 1910 | 4 | 2 | 1,299 | 21,010 | $273 | $355,000 | 19 | 82 |
| 693 Fripp | Corning | 2003 | 4 | 2 | 1,350 | 8,712 | $252 | $340,000 | 52 | 81 |
| 23465 Carona Ave | Corning | 1986 | 3 | 2 | 1,390 | 87,120 | $306 | $425,000 | 90 | 78 |
| 716 Walnut Street | Corning | 1912 | 4 | 2 | 1,664 | 6,970 | $213 | $355,000 | 58 | 73 |
| Total: 5 · Average | 3.6 | 2.0 | 1,371.8 | 26,868 | $272.8 | $369,000 | 60 | |||
| Median | 1,350 | $355,000 | ||||||||
Closed Properties (5)
Closed Comparables
| Address | City | Year | Date | BD | BTH | SqFt | LotSz | LP | SP | SP/SqFt | SP/LP | DIM | Score |
|---|---|---|---|---|---|---|---|---|---|---|---|---|---|
| 1994 North | Corning | 2005 | 10/08/2026 | 3 | 2 | 1,474 | 7,841 | $417,000 | $410,000 | $278 | 0.98 | 69 | 73 |
| 540 Hwy 99W | Corning | 1966 | 05/13/2026 | 4 | 2 | 1,716 | 435,600 | $389,000 | $380,000 | $221 | 0.98 | 40 | 71 |
| 1890 North | Corning | 2005 | 04/28/2026 | 3 | 2 | 1,458 | 9,583 | $420,000 | $400,000 | $274 | 0.95 | 56 | 70 |
| 4175 East Avenue | Corning | 1950 | 12/09/2025 | 2 | 1 | 1,356 | 438,214 | $360,000 | $360,000 | $265 | 1.00 | 138 | 67 |
| 1560 HWY 99 W | Corning | 1991 | 11/26/2025 | 3 | 2 | 1,512 | 1,742,400 | $450,000 | $410,000 | $271 | 0.91 | 151 | 64 |
| Total: 5 · Average | 3.0 | 1.8 | 1,503.2 | 526,727.6 | $392,000 | $392,000 | $261.8 | — | 90.8 | ||||
| Median | 1,474 | $400,000 | $400,000 | ||||||||||
Market Analysis
List vs Sale $/SqFt
Sale Price Trend
Days on Market
Sale vs List Price
This analysis was generated automatically from MLS data. For an in-depth, human-reviewed valuation, contact Joseph Sardella at josephsardella@gmail.com.