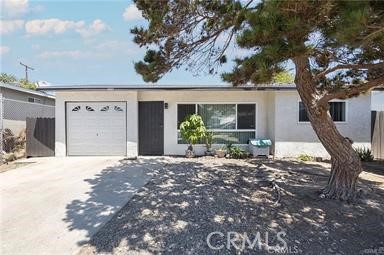
2133 East Lucien Street, Compton, CA 90222
2133 East Lucien Street, Compton, CA 90222
Property Description
Great Property for Multi Family or Live in One and Rent the Other. This Property Offers 2 Separate Units 2 on a Lot. Front House features 3 Bedrooms, 1 Bathroom, Tile and Laminate Flooring, Wall Furnace and 1 Car Garage, Great Condition, clean and ready to occupy. The ADU - 714 sqft. Offers 2 Bedrooms, 1 Bath, Tile Flooring, Wall Furnace, Needs some TLC. Backyard with plenty of Space for a 3rd ADU. ( Total 5 bedrooms, 2 baths). Recent Exterior Paint, New Roof, New Windows, Ceiling Fans, Window AC. The property can be your next Rental or Live in One and Lease the other. Tenant Occupied, ADU will be delivered with Tenants. Showing are Subject to Interior Inspection with an Accepted Offer. . Long Term Tenants.( 15 years). Front House can be delivered Vacant.
Features & Amenities
Property Details
Mortgage Calculator
Current Rates
Comparative Market Analysis
Residential Tier · 5 active · 5 closed
Compton · Single Family Residence
Listed in line with the median closed sale of $725,000. Closed comps sold at 103% of list — strong seller's market.
Price Position
Aligned with the market — fair pricing for the comps.
Active Properties (5)
Active Comparables
| Address | City | Year | BD | BTH | SqFt | LotSz | LP/SqFt | LP | DIM | Score |
|---|---|---|---|---|---|---|---|---|---|---|
| 2055 Nord | Compton | 1964 | 3 | 2 | 1,298 | 4,942 | $530 | $688,500 | 43 | 87 |
| 2211 Grape Ave | Compton | 1947 | 4 | 3 | 1,518 | 5,001 | $457 | $693,000 | 55 | 84 |
| 2030 Wayside | Compton | 1989 | 3 | 2 | 1,442 | 2,461 | $444 | $640,000 | 179 | 77 |
| 2207 Anzac Avenue | Compton | 1947 | 3 | 3 | 1,722 | 5,000 | $377 | $650,000 | 645 | 77 |
| 2011 Grape | Compton | 1947 | 3 | 1 | 1,103 | 5,350 | $630 | $695,000 | 125 | 76 |
| Total: 5 · Average | 3.2 | 2.2 | 1,416.6 | 4,550.8 | $487.6 | $673,300 | 209.4 | |||
| Median | 1,442 | $688,500 | ||||||||
Closed Properties (5)
Closed Comparables
| Address | City | Year | Date | BD | BTH | SqFt | LotSz | LP | SP | SP/SqFt | SP/LP | DIM | Score |
|---|---|---|---|---|---|---|---|---|---|---|---|---|---|
| 720 137th | Compton | 1950 | 07/07/2026 | 3 | 2 | 1,559 | 5,003 | $730,000 | $775,000 | $497 | 1.06 | 130 | 84 |
| 815 134th Place | Compton | 1927 | 06/01/2026 | 5 | 3 | 1,900 | 5,805 | $779,000 | $785,000 | $413 | 1.01 | 52 | 83 |
| 901 134th Place | Compton | 1950 | 10/21/2026 | 3 | 2 | 1,332 | 5,802 | $624,900 | $644,900 | $484 | 1.03 | 54 | 83 |
| 850 132nd | Compton | 1948 | 07/31/2026 | 3 | 3 | 1,458 | 4,545 | $655,000 | $650,000 | $446 | 0.99 | 160 | 80 |
| 411 Plum Street | Compton | 1897 | 12/10/2025 | 3 | 2 | 1,556 | 5,004 | $699,900 | $725,000 | $466 | 1.04 | 54 | 79 |
| Total: 5 · Average | 3.4 | 2.4 | 1,561 | 5,231.8 | $715,980 | $715,980 | $461.2 | — | 90 | ||||
| Median | 1,556 | $725,000 | $725,000 | ||||||||||
Market Analysis
List vs Sale $/SqFt
Sale Price Trend
Days on Market
Sale vs List Price
This analysis was generated automatically from MLS data. For an in-depth, human-reviewed valuation, contact Joseph Sardella at josephsardella@gmail.com.