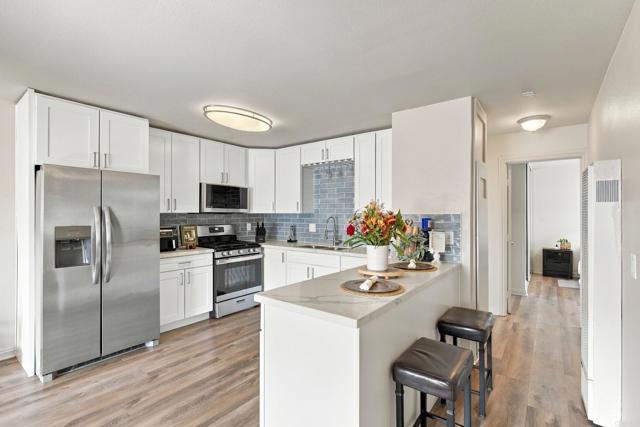
211 South 47th Street, 6, San Diego, CA 92113
211 South 47th Street, 6, San Diego, CA 92113
Property Description
Incredible opportunity to own a 3-bedroom, 2-bath Corner unit condo in San Diego for under $500K.. Eligible for the City of San Diego’s Housing DPA, First-Time Homebuyer Assistance Program, Call LA 4 Details, subject to buyer and property approval. This beautifully updated, move-in-ready condo offers the perfect blend of modern comfort and convenience. Step inside to a bright and inviting open-concept living space, ideal for everyday living and entertaining. Enjoy the added convenience of a private one-car garage and a community laundry. Centrally located with easy access to major freeways, Downtown San Diego, shopping, dining, parks, and everyday essentials. Whether you’re looking for a place to call home or your next investment opportunity, this is one you won’t want to miss!
Features & Amenities
Property Details
Mortgage Calculator
Current Rates
Comparative Market Analysis
Affordable Tier · 5 active · 5 closed
San Diego · Condominium
Listed 5.9% above the median closed sale of $425,000.
Price Position
Positioned above the market — commands a premium.
Active Properties (5)
Active Comparables
| Address | City | Year | BD | BTH | SqFt | LotSz | LP/SqFt | LP | DIM | Score |
|---|---|---|---|---|---|---|---|---|---|---|
| 227 50th Street #9 | San Diego | 1987 | 3 | 2 | 825 | 52,272 | $509 | $419,900 | 23 | 93 |
| 1679 Pentecost Way | San Diego | 1980 | 2 | 1 | 813 | 0 | $517 | $420,000 | 40 | 75 |
| 1845 Bayview Heights Drive | San Diego | 1979 | 2 | 1 | 753 | 0 | $544 | $410,000 | 89 | 72 |
| 3215 44th Street | San Diego | 1980 | 2 | 1 | 770 | 24,829 | $539 | $415,000 | 30 | 66 |
| 2728 B Street | San Diego | 2006 | 1 | 1 | 560 | 0 | $696 | $389,900 | 103 | 52 |
| Total: 5 · Average | 2.0 | 1.2 | 744.2 | 38,550.5 | $561 | $410,960 | 57 | |||
| Median | 770 | $415,000 | ||||||||
Closed Properties (5)
Closed Comparables
| Address | City | Year | Date | BD | BTH | SqFt | LotSz | LP | SP | SP/SqFt | SP/LP | DIM | Score |
|---|---|---|---|---|---|---|---|---|---|---|---|---|---|
| 237 50th Street | San Diego | 1987 | 05/12/2026 | 3 | 2 | 792 | 52,251 | $420,000 | $418,000 | $528 | 0.99 | 61 | 89 |
| 3635 Ash Street | San Diego | 1987 | 05/19/2026 | 2 | 2 | 824 | 300,677 | $459,900 | $445,000 | $540 | 0.97 | 84 | 77 |
| 3285 Ocean View Blvd | San Diego | 1984 | 06/25/2026 | 3 | 2 | 1,036 | 0 | $446,000 | $425,000 | $410 | 0.95 | 90 | 75 |
| 4459 Home Ave | San Diego | 1986 | 05/28/2026 | 2 | 2 | 780 | 0 | $410,000 | $424,000 | $544 | 1.03 | 78 | 74 |
| 3665 Ash Street | San Diego | 1987 | 12/01/2025 | 2 | 2 | 945 | 300,677 | $489,700 | $492,200 | $521 | 1.00 | 81 | 72 |
| Total: 5 · Average | 2.4 | 2.0 | 875.4 | 217,868.333 | $440,840 | $440,840 | $508.6 | — | 78.8 | ||||
| Median | 824 | $425,000 | $425,000 | ||||||||||
Market Analysis
List vs Sale $/SqFt
Sale Price Trend
Days on Market
Sale vs List Price
This analysis was generated automatically from MLS data. For an in-depth, human-reviewed valuation, contact Joseph Sardella at josephsardella@gmail.com.