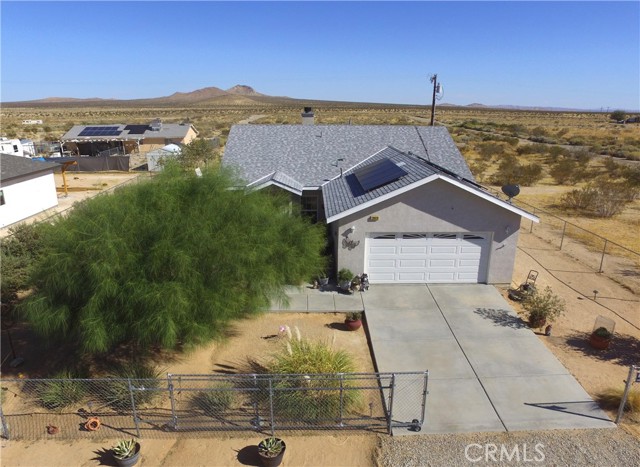
20610 Berkman Drive, California City, CA 93505
20610 Berkman Drive, California City, CA 93505
Property Description
Your Dream Home Awaits! Welcome to 20610 Berkman Drive! This charming 3-bedroom, 2 bath home offers 1482 sq. ft. of comfortable living space. Step inside and you will immediately appreciate the home's vaulted ceiling and spacious layout. Fireplace in living room. Kitchen and eating area with tile floors. Seller will leave refrigerator, stove, microwave oven, washer and dryer. Solar panel will be paid at close of escrow- You will love having the solar panels in the summertime and fireplace in the winter. This house was built in 2007. Owners installed new Roof few months ago in 2026. Don't forget to see Master bedroom is very spacious. Owners made this nice house into a beautiful home inside and out!!! You will love to live here!
Features & Amenities
Property Details
Mortgage Calculator
Current Rates
Comparative Market Analysis
Affordable Tier · 5 active · 5 closed
California City · Single Family Residence
Listed in line with the median closed sale of $273,000.
Price Position
Aligned with the market — fair pricing for the comps.
Active Properties (5)
Active Comparables
| Address | City | Year | BD | BTH | SqFt | LotSz | LP/SqFt | LP | DIM | Score |
|---|---|---|---|---|---|---|---|---|---|---|
| 10611 Garibaldi | California City | 1990 | 3 | 2 | 1,500 | 10,495 | $177 | $264,900 | 44 | 77 |
| 21125 Conklin | California City | 1989 | 3 | 2 | 1,422 | 4,361 | $196 | $279,000 | 40 | 77 |
| 21135 Bancroft Court | California City | 1968 | 3 | 2 | 1,677 | 8,706 | $143 | $239,900 | 86 | 77 |
| 21648 95th | California City | 2007 | 3 | 2 | 1,656 | 10,253 | $171 | $282,900 | 65 | 76 |
| 10331 Loop Boulevard | California City | 1987 | 3 | 2 | 1,828 | 11,240 | $146 | $266,000 | 83 | 75 |
| Total: 5 · Average | 3.0 | 2.0 | 1,616.6 | 9,011 | $166.6 | $266,540 | 63.6 | |||
| Median | 1,656 | $266,000 | ||||||||
Closed Properties (5)
Closed Comparables
| Address | City | Year | Date | BD | BTH | SqFt | LotSz | LP | SP | SP/SqFt | SP/LP | DIM | Score |
|---|---|---|---|---|---|---|---|---|---|---|---|---|---|
| 9712 Nipa | California City | 2005 | 09/23/2026 | 3 | 2 | 1,669 | 10,018 | $273,000 | $273,000 | $164 | 1.00 | 69 | 83 |
| 10348 Peach Ave | California City | 1991 | 08/06/2026 | 3 | 2 | 1,476 | 10,454 | $259,900 | $245,000 | $166 | 0.94 | 58 | 82 |
| 20863 West Lake | California City | 2005 | 06/19/2026 | 3 | 2 | 1,407 | 6,534 | $305,000 | $305,000 | $217 | 1.00 | 58 | 81 |
| 21745 Upton Drive | California City | 2007 | 04/24/2026 | 3 | 2 | 1,514 | 9,320 | $305,000 | $300,000 | $198 | 0.98 | 142 | 80 |
| 10416 Peach Avenue | California City | 1990 | 07/08/2026 | 3 | 2 | 1,305 | 10,019 | $249,999 | $250,000 | $192 | 1.00 | 85 | 80 |
| Total: 5 · Average | 3.0 | 2.0 | 1,474.2 | 9,269 | $274,600 | $274,600 | $187.4 | — | 82.4 | ||||
| Median | 1,476 | $273,000 | $273,000 | ||||||||||
Market Analysis
List vs Sale $/SqFt
Sale Price Trend
Days on Market
Sale vs List Price
This analysis was generated automatically from MLS data. For an in-depth, human-reviewed valuation, contact Joseph Sardella at josephsardella@gmail.com.