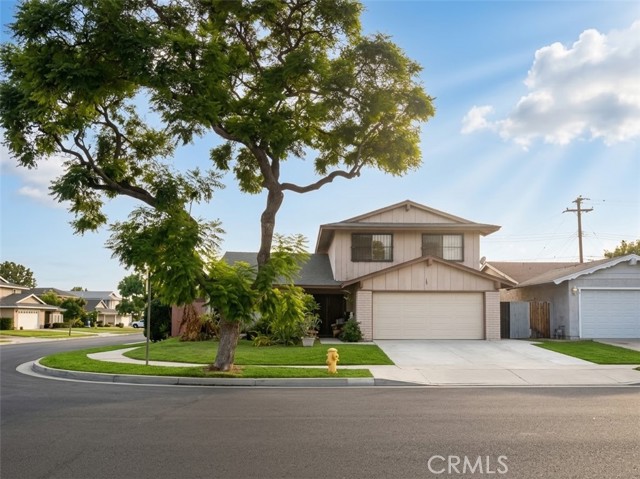
20123 Camba, Carson, CA 90746
20123 Camba, Carson, CA 90746
Property Description
Welcome to this spacious two-story home in Carson, offering 5 bedrooms, 2 bathrooms, and approximately 1,978 square feet of living space on a 5,370-square-foot lot. The home features a functional floor plan with generously sized living areas, an attached two-car garage, and two additional bonus areas near the living room and patio, providing flexible space for storage, hobbies, a home office, or other personal uses. With plenty of room to personalize and make it your own, this property presents an excellent opportunity for buyers looking to add their own touches and unlock its full potential. Conveniently located near shopping, dining, schools, parks, entertainment, and major freeways.
Features & Amenities
Property Details
Mortgage Calculator
Current Rates
Comparative Market Analysis
Residential Tier · 5 active · 5 closed
Carson · Single Family Residence
Listed in line with the median closed sale of $975,000. Closed comps sold at 101% of list — strong seller's market.
Price Position
Aligned with the market — fair pricing for the comps.
Active Properties (5)
Active Comparables
| Address | City | Year | BD | BTH | SqFt | LotSz | LP/SqFt | LP | DIM | Score |
|---|---|---|---|---|---|---|---|---|---|---|
| 20215 Tajauta | Carson | 1969 | 4 | 3 | 2,186 | 5,238 | $457 | $999,000 | 52 | 89 |
| 19708 Dalfsen Avenue | Carson | 1964 | 4 | 2 | 1,488 | 5,526 | $550 | $819,000 | 36 | 89 |
| 19018 Nestor Avenue | Carson | 1964 | 4 | 3 | 1,798 | 5,125 | $556 | $999,000 | 9 | 87 |
| 1119 Gladwick Street | Carson | 1971 | 4 | 2 | 1,718 | 4,978 | $509 | $875,000 | 39 | 86 |
| 20020 Harlan Avenue | Carson | 1967 | 3 | 2 | 1,440 | 6,795 | $608 | $875,000 | 3 | 85 |
| Total: 5 · Average | 3.8 | 2.4 | 1,726 | 5,532.4 | $536 | $913,400 | 27.8 | |||
| Median | 1,718 | $875,000 | ||||||||
Closed Properties (5)
Closed Comparables
| Address | City | Year | Date | BD | BTH | SqFt | LotSz | LP | SP | SP/SqFt | SP/LP | DIM | Score |
|---|---|---|---|---|---|---|---|---|---|---|---|---|---|
| 1879 Cyrene | Carson | 1965 | 04/07/2026 | 3 | 2 | 1,978 | 5,639 | $949,900 | $975,000 | $493 | 1.03 | 68 | 90 |
| 1343 Fernrock | Carson | 1964 | 06/22/2026 | 3 | 2 | 1,978 | 5,106 | $849,900 | $855,000 | $432 | 1.01 | 87 | 88 |
| 19428 Kemp Avenue | Carson | 1963 | 09/17/2026 | 5 | 2 | 1,948 | 5,815 | $1.02M | $1.01M | $521 | 0.99 | 83 | 88 |
| 19407 Cliveden | Carson | 1963 | 02/03/2026 | 5 | 3 | 1,948 | 4,953 | $1.09M | $1.07M | $552 | 0.99 | 111 | 87 |
| 1851 Cyrene Drive | Carson | 1965 | 08/28/2026 | 3 | 2 | 1,362 | 5,133 | $824,999 | $855,000 | $628 | 1.04 | 80 | 86 |
| Total: 5 · Average | 3.8 | 2.2 | 1,842.8 | 5,329.2 | $955,000 | $955,000 | $525.2 | — | 85.8 | ||||
| Median | 1,948 | $975,000 | $975,000 | ||||||||||
Market Analysis
List vs Sale $/SqFt
Sale Price Trend
Days on Market
Sale vs List Price
This analysis was generated automatically from MLS data. For an in-depth, human-reviewed valuation, contact Joseph Sardella at josephsardella@gmail.com.