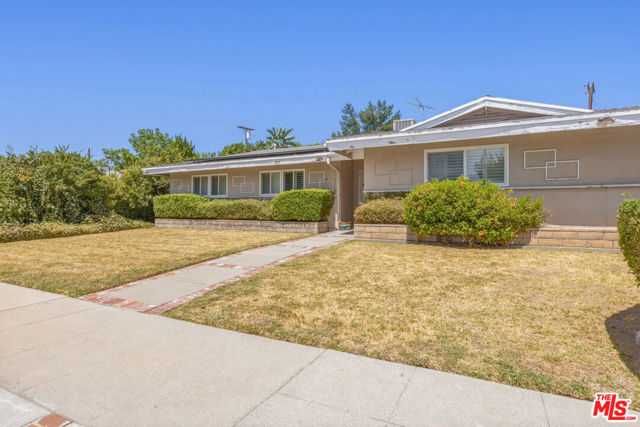
20111 Superior Street, Chatsworth, CA 91311
20111 Superior Street, Chatsworth, CA 91311
Property Description
Welcome to 20111 Superior St in Chatsworth, a charming single-story Ranch-style home offering an excellent opportunity to make it your own. Situated on a spacious lot in an established residential neighborhood, this property features a desirable single-level floor plan with plenty of potential for updating, personalization, or future improvements.The home's classic Ranch architecture showcases a wide frontage, low-profile design, and mature landscaping, while the generous front and rear outdoor spaces provide room to create your ideal Southern California setting.
Features & Amenities
Property Details
Mortgage Calculator
Current Rates
Comparative Market Analysis
Affordable Tier · 5 active · 5 closed
Chatsworth · Single Family Residence
Listed 6.5% below the median closed sale of $855,000.
Price Position
Priced below the market — value advantage over the field.
Active Properties (5)
Active Comparables
| Address | City | Year | BD | BTH | SqFt | LotSz | LP/SqFt | LP | DIM | Score |
|---|---|---|---|---|---|---|---|---|---|---|
| 9638 Oso Avenue | Chatsworth | 1957 | 3 | 2 | 1,368 | 7,543 | $643 | $879,000 | 4 | 96 |
| 20363 Superior Street | Chatsworth | 1959 | 3 | 2 | 1,420 | 7,957 | $599 | $849,900 | 6 | 94 |
| 20450 Payeras Street | Chatsworth | 1959 | 3 | 2 | 1,443 | 7,884 | $623 | $899,000 | 15 | 92 |
| 20158 Gresham | Winnetka | 1959 | 3 | 2 | 1,650 | 7,627 | $515 | $849,000 | 2 | 83 |
| 19808 Londelius Street | Northridge | 1957 | 3 | 2 | 1,637 | 6,800 | $537 | $879,000 | 30 | 81 |
| Total: 5 · Average | 3.0 | 2.0 | 1,503.6 | 7,562.2 | $583.4 | $871,180 | 11.4 | |||
| Median | 1,443 | $879,000 | ||||||||
Closed Properties (5)
Closed Comparables
| Address | City | Year | Date | BD | BTH | SqFt | LotSz | LP | SP | SP/SqFt | SP/LP | DIM | Score |
|---|---|---|---|---|---|---|---|---|---|---|---|---|---|
| 20124 Citronia | Chatsworth | 1958 | 10/29/2026 | 3 | 2 | 1,393 | 7,922 | $829,995 | $800,000 | $574 | 0.96 | 124 | 96 |
| 20119 Marilla Street | Chatsworth | 1958 | 09/25/2026 | 3 | 2 | 1,393 | 7,888 | $849,995 | $850,000 | $610 | 1.00 | 57 | 96 |
| 9624 Oso Avenue | Chatsworth | 1957 | 09/04/2026 | 3 | 2 | 1,368 | 7,542 | $859,995 | $875,000 | $640 | 1.02 | 42 | 94 |
| 9811 Lubao Avenue | Los Angeles | 1957 | 09/30/2026 | 3 | 2 | 1,435 | 7,567 | $865,000 | $860,000 | $599 | 0.99 | 25 | 94 |
| 9532 Casaba Avenue | Chatsworth | 1959 | 11/10/2026 | 3 | 2 | 1,443 | 7,502 | $849,999 | $855,000 | $593 | 1.01 | 33 | 94 |
| Total: 5 · Average | 3.0 | 2.0 | 1,406.4 | 7,684.2 | $848,000 | $848,000 | $603.2 | — | 56.2 | ||||
| Median | 1,393 | $855,000 | $855,000 | ||||||||||
Market Analysis
List vs Sale $/SqFt
Sale Price Trend
Days on Market
Sale vs List Price
This analysis was generated automatically from MLS data. For an in-depth, human-reviewed valuation, contact Joseph Sardella at josephsardella@gmail.com.