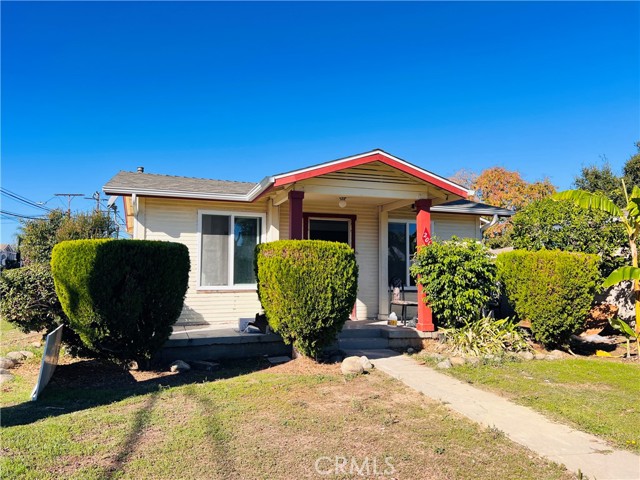
1 / 8
201 North Baltimore, Monterey Park, CA 91754
$950K3bd · 2ba · 1,032 sqft
Lot 5,040 sqft•Single Family Residence•Active•12d on market•MLS# WS-26239281
201 North Baltimore, Monterey Park, CA 91754
MLS# WS-26239281•Residential•Single Family Residence
Active12 days on market
$950,000
3
Beds
2
Baths
1,032
Sq Ft
5,040
Lot Sq Ft
1924
Year Built
None
View
Property Description
Very convenient location in the city of Monterey Park. Walking distance to grocery, park, schools ets. The house has 3 bedrooms and 2 baths. Newly upgraded kitchen and bathroom. new windows, new mini split units and interior wire was replaced.
Features & Amenities
FeeBuilt 1924
Property Details
Land Type
Fee
Year Built
1924
Property Type
Residential
Property Subtype
Single Family Residence
Parking Spaces
1
Garage Spaces
1
Cooling
Electric
View
None
City
Monterey Park
Zip Code
91754
County
Los Angeles
Mortgage Calculator
Current Rates
$
$
%
Monthly Payment
$4,803.72
Principal & Interest
Loan Amount
$760,000
Total Interest
$969,338
Total Payment Over 30 Years
$1,729,338
This calculator provides estimates only. Actual mortgage payments may include taxes, insurance, HOA fees, and PMI. Contact a lender for accurate quotes.
Comparative Market Analysis
Affordable Tier · 5 active · 5 closed
201 North Baltimore, Monterey Park, CA 91754
Monterey Park · Single Family Residence
$950K
Affordable TierBeds
3
Baths
2
Sqft
1,032
Lot
5,040 sqft
Year
1924
$/Sqft
$921
Pool: No✓
View: None✓
Garage: 1-car✓
Listed 10.1% above the median closed sale of $863,000. Price per sqft ($921) is a 32% premium to closed comps ($698). Closed comps sold at 105% of list — strong seller's market.
Price Position
Positioned above the market — commands a premium.
Premium
Subject listed at $950K· $921/sqft
Total list price
Closed comps
vs closed median $863K
+$87K (+10.1%)
Active comps
vs active median $919K
+$31K (+3.4%)
Price per sqft
Closed compsinsufficient comp data
Active comps
vs active avg $/sqft $670
+$251 (+37.4%)
Active Properties (5)
Active Comparables
| Address | City | Year | BD | BTH | SqFt | LotSz | LP/SqFt | LP | DIM | Score |
|---|---|---|---|---|---|---|---|---|---|---|
| 219 Nicholson Avenue | Monterey Park | 1936 | 3 | 2 | 1,310 | 6,773 | $824 | $1.08M | 47 | 84 |
| 512 West Graves Avenue | Monterey Park | 1949 | 2 | 1 | 822 | 5,976 | $1,032 | $848,000 | 74 | 74 |
| 28 Ramona Road | Alhambra | 1963 | 4 | 3 | 1,537 | 3,422 | $598 | $919,000 | 67 | 67 |
| 195 Nicholson Avenue | Monterey Park | 1989 | 3 | 3 | 1,626 | 33,952 | $547 | $889,000 | 304 | 60 |
| 4692 Solstice Avenue | Ontario | 2026 | 4 | 3 | 2,755 | 4,270 | $351 | $965,990 | 185 | 53 |
| Total: 5 · Average | 3.2 | 2.4 | 1,610 | 10,878.6 | $670.4 | $940,398 | 135.4 | |||
| Median | 1,537 | $919,000 | ||||||||
Closed Properties (5)
Closed Comparables
| Address | City | Year | Date | BD | BTH | SqFt | LotSz | LP | SP | SP/SqFt | SP/LP | DIM | Score |
|---|---|---|---|---|---|---|---|---|---|---|---|---|---|
| 2702 New | Rosemead | 1923 | 11/06/2026 | 3 | 2 | 1,231 | 6,847 | $795,000 | $815,000 | $662 | 1.02 | 4 | 84 |
| 303 Moore Avenue | Monterey Park | 1923 | 06/30/2026 | 3 | 2 | 1,425 | 7,806 | $889,000 | $1.02M | $719 | 1.15 | 49 | 82 |
| 909 Mabel | Monterey Park | 1950 | 08/13/2026 | 3 | 2 | 1,216 | 5,921 | $799,000 | $863,000 | $710 | 1.08 | 15 | 80 |
| 522 Cecil Street | Monterey Park | 1956 | 07/07/2026 | 3 | 2 | 1,316 | 5,185 | $858,000 | $890,000 | $676 | 1.04 | 31 | 77 |
| 402 N. Ynez Ave | Monterey Park | 1939 | 12/23/2025 | 2 | 2 | 1,163 | 4,201 | $870,000 | $838,000 | $721 | 0.96 | 56 | 77 |
| Total: 5 · Average | 2.8 | 2.0 | 1,270.2 | 5,992 | $886,200 | $886,200 | $697.6 | — | 31 | ||||
| Median | 1,231 | $863,000 | $863,000 | ||||||||||
Market Analysis
List vs Sale $/SqFt
Sale Price Trend
Days on Market
Sale vs List Price
AI-generated CMA
This analysis was generated automatically from MLS data. For an in-depth, human-reviewed valuation, contact Joseph Sardella at josephsardella@gmail.com.