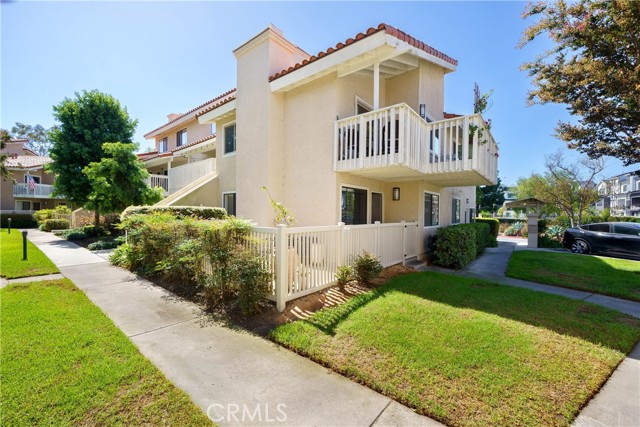
19072 Oceanport, Huntington Beach, CA 92648
19072 Oceanport, Huntington Beach, CA 92648
Property Description
Popular Pierpoint Townhome Community on the edge of Downtown HB. Very Upgraded 2nd floor end unit- Raised ceilings with finished loft. New Kitchen with White Cabinets, Quartz Counters & Back splash. Includes Refrigerator and Washer & Dryer. Vinyl Plank Flooring throughout. Gas Fireplace. Fan in Living Room- slider to Large Lanai. Dual Pane windows. Built in breakfast nook. Private dettached single garage. HOA has pool, Spa & Tennis. Only 2 miles to Beaches and Downtown- Close to HBHS. Gated Community.
Features & Amenities
Property Details
Mortgage Calculator
Current Rates
Comparative Market Analysis
Affordable Tier · 5 active · 5 closed
Huntington Beach · Condominium
Listed 3.4% above the median closed sale of $715,000. Price per sqft ($695) is a 10% premium to closed comps ($631).
Price Position
Aligned with the market — fair pricing for the comps.
Active Properties (5)
Active Comparables
| Address | City | Year | BD | BTH | SqFt | LotSz | LP/SqFt | LP | DIM | Score |
|---|---|---|---|---|---|---|---|---|---|---|
| 7402 Yellowtail Drive | Huntington Beach | 1984 | 2 | 2 | 1,079 | 103,376 | $648 | $699,000 | 113 | 89 |
| 409 Utica Avenue | Huntington Beach | 1993 | 3 | 2 | 1,172 | 0 | $537 | $629,000 | 10 | 85 |
| 606 Lake Street | Huntington Beach | 1988 | 2 | 3 | 1,088 | 0 | $732 | $796,000 | 128 | 79 |
| 306 Coral Reef | Huntington Beach | 1980 | 2 | 2 | 1,250 | 12,843 | $576 | $719,950 | 98 | 79 |
| 20301 Bluffside Circle | Huntington Beach | 1988 | 2 | 2 | 1,101 | 176,372 | $635 | $699,000 | 114 | 78 |
| Total: 5 · Average | 2.2 | 2.2 | 1,138 | 97,530.333 | $625.6 | $708,590 | 92.6 | |||
| Median | 1,101 | $699,000 | ||||||||
Closed Properties (5)
Closed Comparables
| Address | City | Year | Date | BD | BTH | SqFt | LotSz | LP | SP | SP/SqFt | SP/LP | DIM | Score |
|---|---|---|---|---|---|---|---|---|---|---|---|---|---|
| 19092 Shorline Lane | Huntington Beach | 1980 | 04/28/2026 | 2 | 2 | 1,064 | 49,695 | $756,000 | $730,000 | $686 | 0.97 | 59 | 97 |
| 19152 Shoreline | Huntington Beach | 1980 | 06/29/2026 | 2 | 2 | 1,064 | 78,747 | $650,000 | $635,000 | $597 | 0.98 | 80 | 94 |
| 19342 Sunray Lane | Huntington Beach | 1987 | 07/06/2026 | 2 | 2 | 1,084 | 0 | $725,000 | $715,000 | $660 | 0.99 | 16 | 93 |
| 7422 Seastar | Huntington Beach | 1980 | 08/21/2026 | 2 | 2 | 1,248 | 68,652 | $738,888 | $715,000 | $573 | 0.97 | 64 | 92 |
| 7321 Coho | Huntington Beach | 1985 | 09/11/2026 | 2 | 2 | 1,164 | 195,336 | $750,000 | $745,000 | $640 | 0.99 | 28 | 89 |
| Total: 5 · Average | 2.0 | 2.0 | 1,124.8 | 98,107.5 | $708,000 | $708,000 | $631.2 | — | 49.4 | ||||
| Median | 1,084 | $715,000 | $715,000 | ||||||||||
Market Analysis
List vs Sale $/SqFt
Sale Price Trend
Days on Market
Sale vs List Price
This analysis was generated automatically from MLS data. For an in-depth, human-reviewed valuation, contact Joseph Sardella at josephsardella@gmail.com.