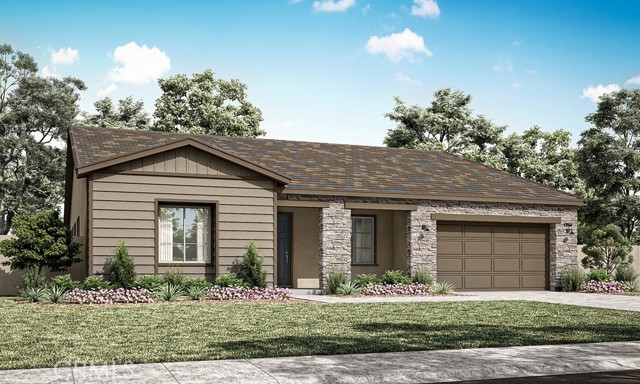
1748 Sandpiper Avenue, Redlands, CA 92374
1748 Sandpiper Avenue, Redlands, CA 92374
Property Description
Welcome to Meadowlark Plan 1, a beautifully designed single-story home featuring 4 bedrooms, 2 and a half bathrooms, and a spacious open-concept layout ideal for modern living. The inviting kitchen offers a large walk-in pantry and flows seamlessly into the main living and dining areas, creating the perfect space for entertaining and everyday enjoyment. A versatile den near the entry provides flexibility for a home office, study, or additional living space. The private primary suite offers a relaxing retreat with thoughtful design and comfort in mind. Construction is just beginning, providing a unique opportunity to select finishes and personalize details to fit your style. Estimated completion is Feb. 2027.
Features & Amenities
Property Details
Mortgage Calculator
Current Rates
Comparative Market Analysis
Residential Tier · 5 active · 5 closed
Redlands · Single Family Residence
Listed 9.4% above the median closed sale of $770,000. Expect a longer timeline — comps averaged 141 days on market.
Price Position
Positioned above the market — commands a premium.
Active Properties (5)
Active Comparables
| Address | City | Year | BD | BTH | SqFt | LotSz | LP/SqFt | LP | DIM | Score |
|---|---|---|---|---|---|---|---|---|---|---|
| 1700 Sandpiper Avenue | Redlands | 2026 | 4 | 3 | 3,345 | 8,754 | $269 | $899,000 | 127 | 93 |
| 1466 Kristion Court | Redlands | 2018 | 4 | 3 | 2,726 | 7,279 | $284 | $775,000 | 31 | 90 |
| 1570 Oriole Street | Redlands | 2026 | 5 | 4 | 3,608 | 8,470 | $268 | $966,000 | 37 | 88 |
| 2167 Snowberry Lane | Mentone | 2008 | 4 | 3 | 2,757 | 8,477 | $263 | $725,000 | 75 | 75 |
| 1089 Tangerine Drive | Redlands | 2005 | 4 | 3 | 2,918 | 6,050 | $267 | $780,000 | 53 | 74 |
| Total: 5 · Average | 4.2 | 3.2 | 3,070.8 | 7,806 | $270.2 | $829,000 | 64.6 | |||
| Median | 2,918 | $780,000 | ||||||||
Closed Properties (5)
Closed Comparables
| Address | City | Year | Date | BD | BTH | SqFt | LotSz | LP | SP | SP/SqFt | SP/LP | DIM | Score |
|---|---|---|---|---|---|---|---|---|---|---|---|---|---|
| 1558 Oriole Street | Redlands | 2025 | 06/30/2026 | 4 | 3 | 2,813 | 8,695 | $899,000 | $838,171 | $298 | 0.93 | 322 | 97 |
| 1718 Sandpiper Avenue | Redlands | 2026 | 09/23/2026 | 5 | 4 | 3,608 | 8,233 | $899,000 | $962,215 | $267 | 1.07 | 186 | 87 |
| 1430 Shannon | Redlands | 2020 | 09/09/2026 | 4 | 3 | 2,227 | 6,959 | $770,000 | $770,000 | $346 | 1.00 | 71 | 84 |
| 1574 Foothill | Redlands | 2000 | 03/30/2026 | 4 | 3 | 2,260 | 9,620 | $740,000 | $748,000 | $331 | 1.01 | 35 | 82 |
| 1413 Gold Buckle Ct. | Redlands | 2003 | 09/17/2026 | 4 | 3 | 2,355 | 7,405 | $739,800 | $725,000 | $308 | 0.98 | 91 | 80 |
| Total: 5 · Average | 4.2 | 3.2 | 2,652.6 | 8,182.4 | $808,677.2 | $808,677.2 | $310 | — | 141 | ||||
| Median | 2,355 | $770,000 | $770,000 | ||||||||||
Market Analysis
List vs Sale $/SqFt
Sale Price Trend
Days on Market
Sale vs List Price
This analysis was generated automatically from MLS data. For an in-depth, human-reviewed valuation, contact Joseph Sardella at josephsardella@gmail.com.