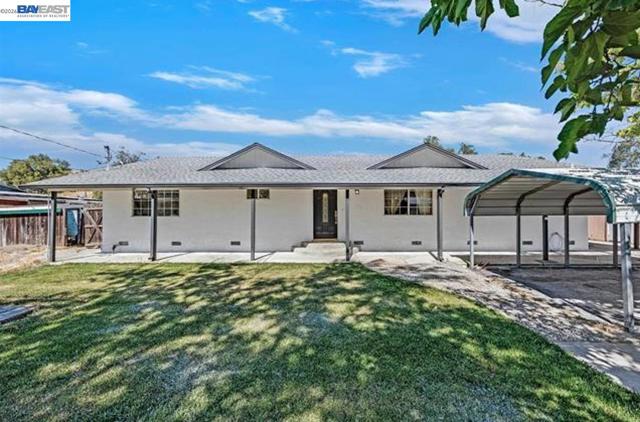
16881 North Midway Rd, Tracy, CA 95377
16881 North Midway Rd, Tracy, CA 95377
Property Description
Newly renovated kitchen floors and 2 bathrooms. Escape, Explore, and Expand on 8 Acres of Possibility! Some photos virtually staged. Discover your own private sanctuary just minutes from the 580 Freeway — where country living meets everyday convenience. This charming single-level 4-bedroom, 2-bath home sits on a serene 8-acre parcel offering endless potential — many possibilities, vineyards to workshops and car collections. Fresh interior and exterior paint showcase its welcoming character, while multiple garages, workshops, and covered parking areas provide room for all your vehicles, boats, RVs, and toys. The extra garage with built-in air compressor and hillside space ideal for future wine storage are just the beginning of what’s possible here. Fully fenced and gated for privacy, this property invites you to unwind, create, and make it your own. Opportunities like this are rare — schedule your visit today and experience the freedom and potential this special estate offers!
Features & Amenities
Property Details
Mortgage Calculator
Current Rates
Comparative Market Analysis
Residential Tier · 2 active · 1 closed
Tracy · Single Family Residence
Listed 17.2% above the median closed sale of $1,279,000. Price per sqft ($861) is a 143% premium to closed comps ($354). Closed comps sold at 95% of list — buyers have negotiating leverage.
Price Position
Positioned above the market — commands a premium.
Active Properties (2)
Active Comparables
| Address | City | Year | BD | BTH | SqFt | LotSz | LP/SqFt | LP | DIM | Score |
|---|---|---|---|---|---|---|---|---|---|---|
| 14740 Altamont Pass Rd | 1984 | 4 | 3 | 3,122 | 233,482 | $442 | $1.38M | 65 | 59 | |
| 23110 Los Ranchos Dr | Tracy | 1985 | 4 | 3 | 2,452 | 61,855 | $530 | $1.30M | 122 | 46 |
| Total: 2 · Average | 4.0 | 3.0 | 2,787 | 147,668.5 | $486 | $1.34M | 93.5 | |||
| Median | 3,122 | $1.38M | ||||||||
Closed Properties (1)
Closed Comparables
| Address | City | Year | Date | BD | BTH | SqFt | LotSz | LP | SP | SP/SqFt | SP/LP | DIM | Score |
|---|---|---|---|---|---|---|---|---|---|---|---|---|---|
| 1553 Perkins Place | 2019 | 05/20/2026 | 4 | 4 | 3,611 | 11,117 | $1.35M | $1.28M | $354 | 0.95 | 103 | 42 | |
| Total: 1 · Average | 4.0 | 4.0 | 3,611 | 11,117 | $1.28M | $1.28M | $354 | — | 103 | ||||
| Median | 3,611 | $1.28M | $1.28M | ||||||||||
Market Analysis
List vs Sale $/SqFt
Sale Price Trend
Days on Market
Sale vs List Price
This analysis was generated automatically from MLS data. For an in-depth, human-reviewed valuation, contact Joseph Sardella at josephsardella@gmail.com.