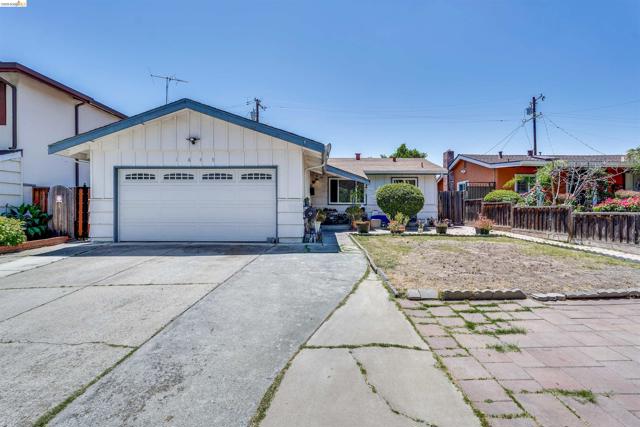
1649 Mount Oliveira Drive, San Jose, CA 95127
1649 Mount Oliveira Drive, San Jose, CA 95127
Property Description
This single-level 3-bedroom, 2-bathroom home presents an exceptional opportunity to customize a space tailored to your personal style. Featuring a functional, versatile floor plan well-suited for everyday living, entertaining, or working from home, this property offers incredible potential. Bring your vision and TLC to transform this house into your ideal dream home. Enjoy peaceful neighborhood surroundings with the added convenience of being minutes from top-rated schools, parks, shopping, dining, public transit, and major commuter freeways. Disclosure: https://hlm.homelight.com/link/1649-Mount-Oliveira-Drive-1sc85q7h
Features & Amenities
Property Details
Mortgage Calculator
Current Rates
Comparative Market Analysis
Affordable Tier · 1 active · 5 closed
San Jose · Single Family Residence
Listed 4.3% below the median closed sale of $930,000. Closed comps sold at 104% of list — strong seller's market.
Price Position
Aligned with the market — fair pricing for the comps.
Active Properties (1)
Active Comparables
| Address | City | Year | BD | BTH | SqFt | LotSz | LP/SqFt | LP | DIM | Score |
|---|---|---|---|---|---|---|---|---|---|---|
| 1307 Cathay Dr | San Jose | 1961 | 3 | 2 | 960 | 5,000 | $832 | $799,000 | 83 | 77 |
| Total: 1 · Average | 3.0 | 2.0 | 960 | 5,000 | $832 | $799,000 | 83 | |||
| Median | 960 | $799,000 | ||||||||
Closed Properties (5)
Closed Comparables
| Address | City | Year | Date | BD | BTH | SqFt | LotSz | LP | SP | SP/SqFt | SP/LP | DIM | Score |
|---|---|---|---|---|---|---|---|---|---|---|---|---|---|
| 1472 Mount Whitney Dr | San Jose | 1958 | 08/06/2026 | 3 | 2 | 1,000 | 5,000 | $949,888 | $949,888 | $950 | 1.00 | 78 | 90 |
| 14391 Victoria Ct | San Jose | 1954 | 08/04/2026 | 3 | 1 | 960 | 4,992 | $899,000 | $900,000 | $938 | 1.00 | 61 | 83 |
| 13602 Marmont Way | San Jose | 1952 | 06/29/2026 | 3 | 1 | 1,056 | 5,040 | $899,000 | $930,000 | $881 | 1.03 | 26 | 78 |
| 198 Cragmont Ave | San Jose | 1935 | 06/26/2026 | 3 | 2 | 1,056 | 7,000 | $799,000 | $850,000 | $805 | 1.06 | 29 | 75 |
| 2966 Ridgemont Dr | San Jose | 1968 | 07/21/2026 | 4 | 2 | 1,496 | 5,600 | $899,000 | $1.00M | $669 | 1.11 | 35 | 74 |
| Total: 5 · Average | 3.2 | 1.6 | 1,113.6 | 5,526.4 | $926,017.6 | $926,017.6 | $848.6 | — | 45.8 | ||||
| Median | 1,056 | $930,000 | $930,000 | ||||||||||
Market Analysis
List vs Sale $/SqFt
Sale Price Trend
Days on Market
Sale vs List Price
This analysis was generated automatically from MLS data. For an in-depth, human-reviewed valuation, contact Joseph Sardella at josephsardella@gmail.com.