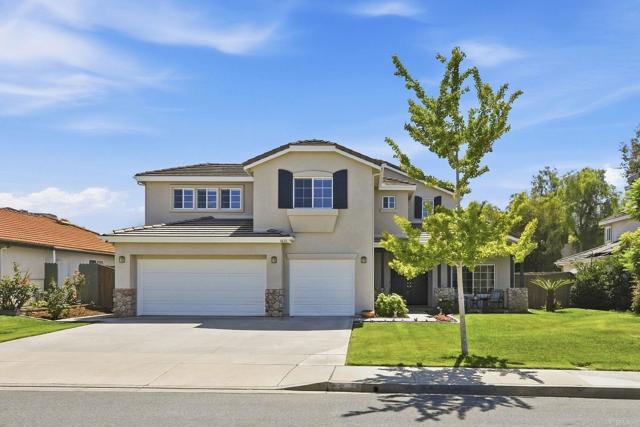
1635 Shire Avenue, Oceanside, CA 92057
1635 Shire Avenue, Oceanside, CA 92057
Property Description
Updated kitchen, a primary bath remodeled within the past year, and a big backyard with six mature fruit trees, in Jeffries Ranch with NO HOA and NO MELLO-ROOS. The sellers already did the big-ticket work: updated HVAC, replacement windows in several rooms and fresh exterior paint. The kitchen opens to the main living area, and a second living space gives everyone room. A bedroom and full bath on the main level work well as a guest room or home office. Upstairs there’s a bonus room that can be an office, gym, playroom or sixth bedroom. Out back there’s a covered patio, a big lawn and avocado, lemon and Asian pear trees. The yard may have room for a pool or ADU; buyer to verify with the City of Oceanside. Close to Mission Meadows Elementary and Guajome Regional Park. 5 bed + bonus room / 3 bath / approx. 2,631 sq ft.
Features & Amenities
Property Details
Mortgage Calculator
Current Rates
Comparative Market Analysis
Residential Tier · 5 active · 5 closed
Oceanside · Single Family Residence
Listed in line with the median closed sale of $1,225,000. Closed comps sold at 101% of list — strong seller's market.
Price Position
Aligned with the market — fair pricing for the comps.
Active Properties (5)
Active Comparables
| Address | City | Year | BD | BTH | SqFt | LotSz | LP/SqFt | LP | DIM | Score |
|---|---|---|---|---|---|---|---|---|---|---|
| 5611 Spanish Horse | Oceanside | 2013 | 5 | 3 | 3,169 | 10,019 | $394 | $1.25M | 125 | 81 |
| 274 Hadley Way | Oceanside | 2025 | 4 | 4 | 3,335 | 11,913 | $414 | $1.38M | 22 | 65 |
| 5345 Village Drive | Oceanside | 2005 | 5 | 3 | 3,643 | 0 | $324 | $1.18M | 39 | 59 |
| 1268 Bellingham Drive | Oceanside | 2008 | 4 | 5 | 3,203 | 5,103 | $359 | $1.15M | 119 | 57 |
| 1003 Vista Pointe Boulevard | Oceanside | 2007 | 5 | 5 | 3,533 | 6,715 | $325 | $1.15M | 44 | 56 |
| Total: 5 · Average | 4.6 | 4.0 | 3,376.6 | 8,437.5 | $363.2 | $1.22M | 69.8 | |||
| Median | 3,335 | $1.18M | ||||||||
Closed Properties (5)
Closed Comparables
| Address | City | Year | Date | BD | BTH | SqFt | LotSz | LP | SP | SP/SqFt | SP/LP | DIM | Score |
|---|---|---|---|---|---|---|---|---|---|---|---|---|---|
| 1463 Belmont Park Road | Oceanside | 2000 | 01/28/2026 | 5 | 3 | 2,963 | 11,326 | $1.32M | $1.30M | $440 | 0.98 | 109 | 85 |
| 1592 Wagon Wheel Drive | Oceanside | 1995 | 07/14/2026 | 4 | 3 | 2,673 | 15,117 | $1.15M | $1.23M | $458 | 1.07 | 34 | 85 |
| 1791 Palomino Court | Oceanside | 1996 | 03/30/2026 | 4 | 2 | 1,846 | 8,104 | $1.14M | $1.14M | $616 | 1.00 | 54 | 79 |
| 5615 Spanish Horse | Oceanside | 2013 | 07/30/2026 | 5 | 4 | 3,855 | 10,193 | $1.37M | $1.37M | $355 | 1.00 | 34 | 74 |
| 5809 Jeffries Ranch Road | Oceanside | 1979 | 11/02/2026 | 3 | 2 | 2,206 | 19,210 | $1.15M | $1.18M | $535 | 1.03 | 26 | 72 |
| Total: 5 · Average | 4.2 | 2.8 | 2,708.6 | 12,790 | $1.24M | $1.24M | $480.8 | — | 51.4 | ||||
| Median | 2,673 | $1.23M | $1.23M | ||||||||||
Market Analysis
List vs Sale $/SqFt
Sale Price Trend
Days on Market
Sale vs List Price
This analysis was generated automatically from MLS data. For an in-depth, human-reviewed valuation, contact Joseph Sardella at josephsardella@gmail.com.