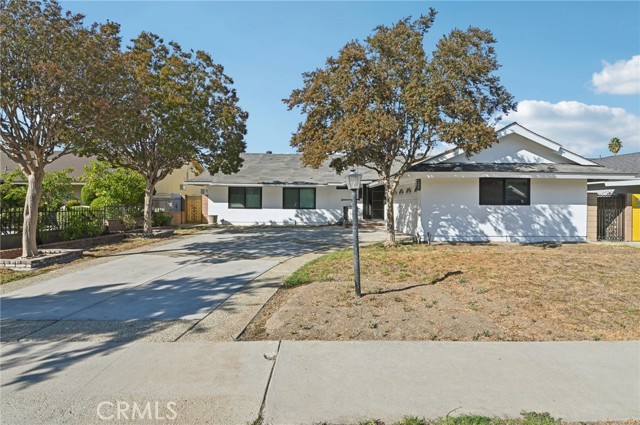
15937 Londelius Street, North Hills, CA 91343
15937 Londelius Street, North Hills, CA 91343
Property Description
Located in a desirable North Hills neighborhood this beautiful home features 3 bedrooms, 3 baths with over 2000 sqft of living space. Custom modern entry door leads you to the newly remodeled open concept living room / dining room with gas fireplace, one of a kind custom chef's kitchen with high end fixtures, built-in appliances and a large center island with beautiful stone counter and waterfall finish. Additional features include updated dual pane windows, updated roof, updated laminate flooring and recessed lighting throughout and so much more.
Features & Amenities
Property Details
Mortgage Calculator
Current Rates
Comparative Market Analysis
Residential Tier · 5 active · 5 closed
North Hills · Single Family Residence
Listed 8.7% below the median closed sale of $1,160,000. Closed comps sold at 102% of list — strong seller's market.
Price Position
Priced below the market — value advantage over the field.
Active Properties (5)
Active Comparables
| Address | City | Year | BD | BTH | SqFt | LotSz | LP/SqFt | LP | DIM | Score |
|---|---|---|---|---|---|---|---|---|---|---|
| 15859 Parthenia Street | North Hills | 1976 | 4 | 3 | 2,232 | 7,614 | $537 | $1.20M | 25 | 87 |
| 16100 Londelius Street | Los Angeles | 1960 | 4 | 2 | 1,926 | 8,447 | $506 | $975,000 | 60 | 85 |
| 16451 Knapp St | North Hills | 1959 | 4 | 3 | 2,131 | 8,438 | $516 | $1.10M | 88 | 84 |
| 9134 Swinton Avenue | North Hills | 1956 | 4 | 2 | 1,611 | 7,245 | $577 | $929,900 | 59 | 81 |
| 16003 Dearborn Street | North Hills | 1958 | 4 | 4 | 2,366 | 7,563 | $452 | $1.07M | 90 | 80 |
| Total: 5 · Average | 4.0 | 2.8 | 2,053.2 | 7,861.4 | $517.6 | $1.05M | 64.4 | |||
| Median | 2,131 | $1.07M | ||||||||
Closed Properties (5)
Closed Comparables
| Address | City | Year | Date | BD | BTH | SqFt | LotSz | LP | SP | SP/SqFt | SP/LP | DIM | Score |
|---|---|---|---|---|---|---|---|---|---|---|---|---|---|
| 15955 Londelius Street | North Hills | 1958 | 08/11/2026 | 5 | 4 | 2,309 | 7,539 | $1.20M | $1.19M | $515 | 0.99 | 129 | 86 |
| 16009 Acre Street | North Hills | 1957 | 08/21/2026 | 4 | 3 | 2,332 | 7,597 | $1.15M | $1.16M | $497 | 1.01 | 36 | 86 |
| 15900 Acre Street | North Hills | 1964 | 08/25/2026 | 4 | 3 | 2,504 | 9,579 | $1.10M | $1.21M | $484 | 1.10 | 68 | 83 |
| 8828 Collett | North Hills | 1959 | 05/04/2026 | 3 | 2 | 1,712 | 8,120 | $959,000 | $970,000 | $567 | 1.01 | 46 | 83 |
| 15852 Bryant Street | North Hills | 1957 | 10/14/2026 | 3 | 2 | 1,413 | 7,771 | $969,000 | $960,000 | $679 | 0.99 | 85 | 83 |
| Total: 5 · Average | 3.8 | 2.8 | 2,054 | 8,121.2 | $1.10M | $1.10M | $548.4 | — | 72.8 | ||||
| Median | 2,309 | $1.16M | $1.16M | ||||||||||
Market Analysis
List vs Sale $/SqFt
Sale Price Trend
Days on Market
Sale vs List Price
This analysis was generated automatically from MLS data. For an in-depth, human-reviewed valuation, contact Joseph Sardella at josephsardella@gmail.com.