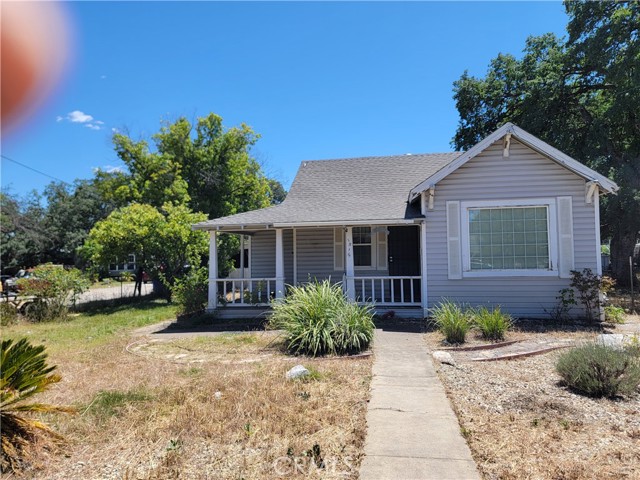
1515 Derby Road, Red Bluff, CA 96080
1515 Derby Road, Red Bluff, CA 96080
Property Description
Bring your tools and ideas to bring this cute ranch home back to its glory. Several outbuildings for storage, shop and parking your toys. An additional, separate outbuilding was originally called a "bunk house" with bedroom and bathroom and small carport behind it. Good size lot with RV parking and more. Property is in a trust. Tax records show 1172 Sq ft with estimated 500 sq ft "bunk house". Buyer to verify to their satisfaction.
Features & Amenities
Property Details
Mortgage Calculator
Current Rates
Comparative Market Analysis
Affordable Tier · 3 active · 5 closed
Red Bluff · Single Family Residence
Listed in line with the median closed sale of $245,000. Price per sqft ($147) is a 28% discount to closed comps ($203). Expect a longer timeline — comps averaged 146 days on market.
Price Position
Aligned with the market — fair pricing for the comps.
Active Properties (3)
Active Comparables
| Address | City | Year | BD | BTH | SqFt | LotSz | LP/SqFt | LP | DIM | Score |
|---|---|---|---|---|---|---|---|---|---|---|
| 40 Sandy Way | Red Bluff | 1960 | 2 | 1 | 952 | 7,841 | $226 | $215,000 | 10 | 67 |
| 224 S Jackson st | Red Bluff | 1941 | 3 | 1 | 986 | 7,405 | $273 | $269,000 | 108 | 67 |
| 1490 Orange Street | Red Bluff | 1969 | 3 | 2 | 966 | 6,000 | $290 | $279,900 | 80 | 58 |
| Total: 3 · Average | 2.7 | 1.3 | 968 | 7,082 | $263 | $254,633.333 | 66 | |||
| Median | 966 | $269,000 | ||||||||
Closed Properties (5)
Closed Comparables
| Address | City | Year | Date | BD | BTH | SqFt | LotSz | LP | SP | SP/SqFt | SP/LP | DIM | Score |
|---|---|---|---|---|---|---|---|---|---|---|---|---|---|
| 855 Johnson | Red Bluff | 1925 | 10/30/2026 | 4 | 2 | 1,566 | 7,060 | $250,000 | $240,000 | $153 | 0.96 | 183 | 78 |
| 1359 2nd | Red Bluff | 1915 | 07/01/2026 | 3 | 1 | 1,221 | 5,867 | $214,950 | $225,000 | $184 | 1.05 | 212 | 75 |
| 1720 Luning Street | Red Bluff | 1954 | 05/20/2026 | 3 | 1 | 1,366 | 6,098 | $265,000 | $275,000 | $201 | 1.04 | 49 | 73 |
| 2520 Oriole | Red Bluff | 1980 | 08/07/2026 | 2 | 2 | 1,036 | 6,000 | $289,900 | $277,000 | $267 | 0.96 | 40 | 67 |
| 1160 Orange Street | Red Bluff | 1961 | 05/11/2026 | 3 | 1 | 1,166 | 81,457 | $249,000 | $245,000 | $210 | 0.98 | 245 | 66 |
| Total: 5 · Average | 3.0 | 1.4 | 1,271 | 21,296.4 | $252,400 | $252,400 | $203 | — | 145.8 | ||||
| Median | 1,221 | $245,000 | $245,000 | ||||||||||
Market Analysis
List vs Sale $/SqFt
Sale Price Trend
Days on Market
Sale vs List Price
This analysis was generated automatically from MLS data. For an in-depth, human-reviewed valuation, contact Joseph Sardella at josephsardella@gmail.com.