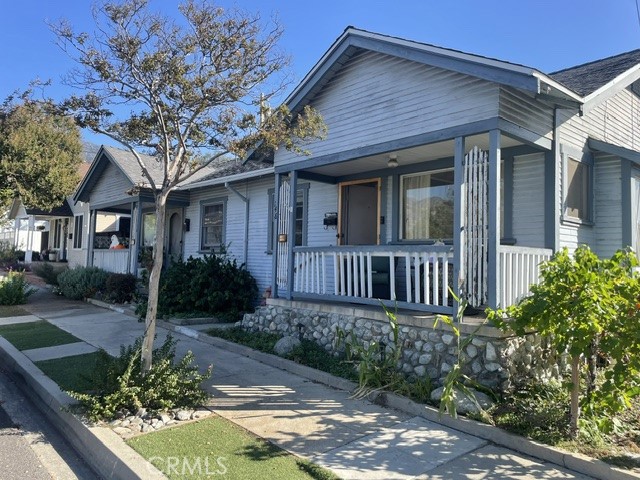
148 North Shamrock Avenue North, Monrovia, CA 91016
148 North Shamrock Avenue North, Monrovia, CA 91016
Property Description
A fantastic opportunity to live in a darling 1 bedroom/1 bath home and have another 1 bed/1 bath unit that you can rent for income! This residence is in a wonderful area of Monrovia, and features a 1 car garage, 1 car port and driveway parking. There is yard in the back and a neighborly front porch on each unit. Great for family to share or as a start to your investment portfolio. This property blends charm, location and endless possibilities.
Features & Amenities
Property Details
Mortgage Calculator
Current Rates
Comparative Market Analysis
Affordable Tier · 2 active · 4 closed
Monrovia · Duplex
Listed 6.9% below the median closed sale of $922,503. Price per sqft ($795) is a 45% premium to closed comps ($548).
Price Position
Priced below the market — value advantage over the field.
Active Properties (2)
Active Comparables
| Address | City | Year | BD | BTH | SqFt | LotSz | LP/SqFt | LP | DIM | Score |
|---|---|---|---|---|---|---|---|---|---|---|
| 206 Madeline Drive | Monrovia | 1952 | 3 | 3 | 1,586 | 8,300 | $560 | $888,000 | 18 | 67 |
| 203 Benrud Street | Monrovia | 1951 | 0 | 0 | 1,588 | 6,048 | $503 | $799,000 | 39 | 44 |
| Total: 2 · Average | 1.5 | 1.5 | 1,587 | 7,174 | $531.5 | $843,500 | 28.5 | |||
| Median | 1,588 | $888,000 | ||||||||
Closed Properties (4)
Closed Comparables
| Address | City | Year | Date | BD | BTH | SqFt | LotSz | LP | SP | SP/SqFt | SP/LP | DIM | Score |
|---|---|---|---|---|---|---|---|---|---|---|---|---|---|
| 244 Lime | Monrovia | 1934 | 04/30/2026 | 4 | 2 | 1,480 | 7,921 | $980,000 | $985,000 | $666 | 1.00 | 45 | 70 |
| 119 Alta Vista Avenue | Monrovia | 1950 | 09/15/2025 | 3 | 2 | 1,504 | 8,732 | $988,000 | $930,006 | $618 | 0.94 | 38 | 58 |
| 114 Canyon Boulevard | Monrovia | 1953 | 08/29/2025 | 4 | 2 | 1,708 | 7,006 | $895,000 | $915,000 | $536 | 1.02 | 35 | 56 |
| 237 Central Avenue | Monrovia | 1952 | 11/14/2025 | 4 | 2 | 2,150 | 9,313 | $798,000 | $798,000 | $371 | 1.00 | 29 | 39 |
| Total: 4 · Average | 3.8 | 2.0 | 1,710.5 | 8,243 | $907,001.5 | $907,001.5 | $547.75 | — | 36.75 | ||||
| Median | 1,708 | $930,006 | $930,006 | ||||||||||
Market Analysis
List vs Sale $/SqFt
Sale Price Trend
Days on Market
Sale vs List Price
This analysis was generated automatically from MLS data. For an in-depth, human-reviewed valuation, contact Joseph Sardella at josephsardella@gmail.com.