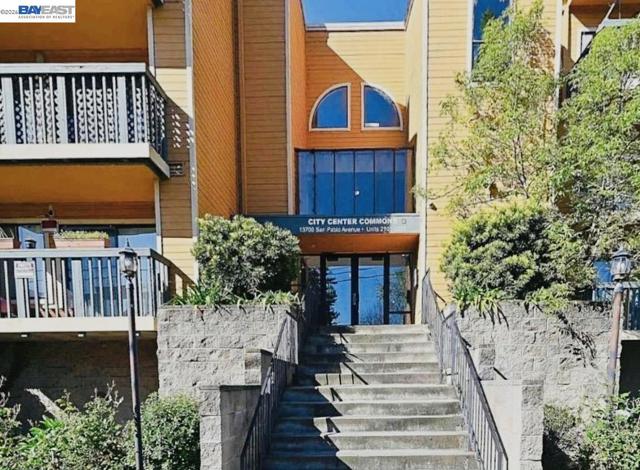
13700 SAN PABLO AVE, 1210, San Pablo, CA 94806
13700 SAN PABLO AVE, 1210, San Pablo, CA 94806
Property Description
Welcome to this beautiful one-bedroom unit, featuring a spacious living room with balcony, updated kitchen, and new flooring throughout. The bedroom offers two large closets for ample storage. Includes gated parking, elevator access, community pool, and on-site laundry. City Center Commons complex in San Pablo downtown with easy access to shopping, freeway, and BART.
Features & Amenities
Property Details
Mortgage Calculator
Current Rates
Comparative Market Analysis
Affordable Tier · 2 active · 5 closed
San Pablo · Condominium
Listed 3.2% above the median closed sale of $222,000. Closed comps sold at 93% of list — buyers have negotiating leverage.
Price Position
Aligned with the market — fair pricing for the comps.
Active Properties (2)
Active Comparables
| Address | City | Year | BD | BTH | SqFt | LotSz | LP/SqFt | LP | DIM | Score |
|---|---|---|---|---|---|---|---|---|---|---|
| 2121 Vale Rd | San Pablo | 1984 | 2 | 2 | 1,198 | 0 | $208 | $249,000 | 94 | 73 |
| 1532 Chanslor AVE | Richmond | 1981 | 2 | 1 | 816 | 13,500 | $260 | $212,000 | 106 | 73 |
| Total: 2 · Average | 2.0 | 1.5 | 1,007 | 13,500 | $234 | $230,500 | 100 | |||
| Median | 1,198 | $249,000 | ||||||||
Closed Properties (5)
Closed Comparables
| Address | City | Year | Date | BD | BTH | SqFt | LotSz | LP | SP | SP/SqFt | SP/LP | DIM | Score |
|---|---|---|---|---|---|---|---|---|---|---|---|---|---|
| 4186 San Pablo Dam Rd | El Sobrante | 1980 | 10/26/2026 | 1 | 1 | 776 | 0 | $233,000 | $227,000 | $293 | 0.97 | 133 | 79 |
| 2021 Market Ave | San Pablo | 1980 | 09/10/2025 | 1 | 1 | 691 | 0 | $244,888 | $222,000 | $321 | 0.91 | 137 | 78 |
| 4740 Appian Way | El Sobrante | 1973 | 09/29/2026 | 1 | 1 | 680 | 0 | $249,000 | $210,000 | $309 | 0.84 | 102 | 71 |
| 1532 Chanslor Ave | Richmond | 1981 | 10/06/2025 | 2 | 1 | 816 | 13,700 | $224,900 | $210,000 | $257 | 0.93 | 89 | 67 |
| 121 Collins Street | Richmond | 1942 | 08/25/2025 | 2 | 1 | 781 | 0 | $245,000 | $242,500 | $310 | 0.99 | 52 | 57 |
| Total: 5 · Average | 1.4 | 1.0 | 748.8 | 13,700 | $222,300 | $222,300 | $298 | — | 102.6 | ||||
| Median | 776 | $222,000 | $222,000 | ||||||||||
Market Analysis
List vs Sale $/SqFt
Sale Price Trend
Days on Market
Sale vs List Price
This analysis was generated automatically from MLS data. For an in-depth, human-reviewed valuation, contact Joseph Sardella at josephsardella@gmail.com.