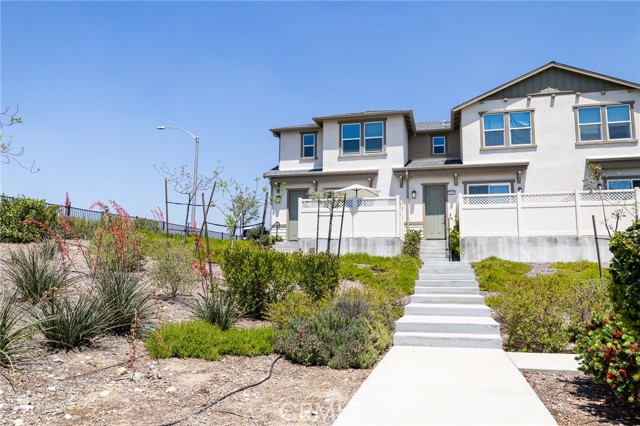
1362 Anise, Upland, CA 91786
1362 Anise, Upland, CA 91786
Property Description
WELCOME HOME!!!! The "open and airy" concept on the main floor creates a spacious feel, while the downstairs half-bath is perfect for guest access. High ceilings, recessed lighting, light-colored flooring that enhances that airy sensation, Upper-Level Convenience: Having the laundry room upstairs near the bedrooms is a major win for daily chores—no lugging heavy baskets up and down stairs. Outdoor Living: The nice patio provides a private spot for morning coffee or a relaxation spot. Being an end-cap unit means you only share one common wall, offering a quieter space all located within a gated community, offering an extra layer of privacy and controlled access.
Features & Amenities
Property Details
Mortgage Calculator
Current Rates
Comparative Market Analysis
Affordable Tier · 5 active · 5 closed
Upland · Condominium
Listed 5.6% above the median closed sale of $540,000.
Price Position
Positioned above the market — commands a premium.
Active Properties (5)
Active Comparables
| Address | City | Year | BD | BTH | SqFt | LotSz | LP/SqFt | LP | DIM | Score |
|---|---|---|---|---|---|---|---|---|---|---|
| 184 Royal | Upland | 2016 | 2 | 4 | 1,377 | 672 | $407 | $559,900 | 86 | 83 |
| 8545 Baldy Vista | Rancho Cucamonga | 1987 | 3 | 3 | 1,231 | 2,000 | $406 | $499,800 | 44 | 79 |
| 8543 RICHWOOD Drive | Rancho Cucamonga | 1983 | 3 | 2 | 1,343 | 1,343 | $412 | $553,000 | 51 | 78 |
| 595 Orlando Court | Upland | 2015 | 2 | 2 | 923 | 539 | $525 | $485,000 | 143 | 77 |
| 8360 Branchwood | Rancho Cucamonga | 1984 | 2 | 2 | 1,167 | 1,450 | $420 | $489,900 | 40 | 70 |
| Total: 5 · Average | 2.4 | 2.6 | 1,208.2 | 1,200.8 | $434 | $517,520 | 72.8 | |||
| Median | 1,231 | $499,800 | ||||||||
Closed Properties (5)
Closed Comparables
| Address | City | Year | Date | BD | BTH | SqFt | LotSz | LP | SP | SP/SqFt | SP/LP | DIM | Score |
|---|---|---|---|---|---|---|---|---|---|---|---|---|---|
| 1376 Chervil Way | Upland | 2023 | 07/08/2026 | 2 | 3 | 1,211 | 800 | $559,900 | $548,500 | $453 | 0.98 | 113 | 93 |
| 163 Tarragon | Upland | 2020 | 12/16/2025 | 3 | 3 | 1,280 | 1,026 | $539,000 | $530,000 | $414 | 0.98 | 69 | 91 |
| 144 Royal Way | Upland | 2017 | 10/15/2026 | 2 | 3 | 1,377 | 672 | $548,800 | $540,000 | $392 | 0.98 | 117 | 87 |
| 181 Dorsett Avenue | Upland | 2017 | 11/10/2026 | 2 | 4 | 1,208 | 0 | $539,888 | $500,000 | $414 | 0.93 | 139 | 85 |
| 8475 Gabrielino Court | Rancho Cucamonga | 2026 | 04/16/2026 | 3 | 3 | 1,417 | 0 | $616,020 | $613,020 | $433 | 0.99 | 78 | 85 |
| Total: 5 · Average | 2.4 | 3.2 | 1,298.6 | 832.667 | $546,304 | $546,304 | $421.2 | — | 103.2 | ||||
| Median | 1,280 | $540,000 | $540,000 | ||||||||||
Market Analysis
List vs Sale $/SqFt
Sale Price Trend
Days on Market
Sale vs List Price
This analysis was generated automatically from MLS data. For an in-depth, human-reviewed valuation, contact Joseph Sardella at josephsardella@gmail.com.