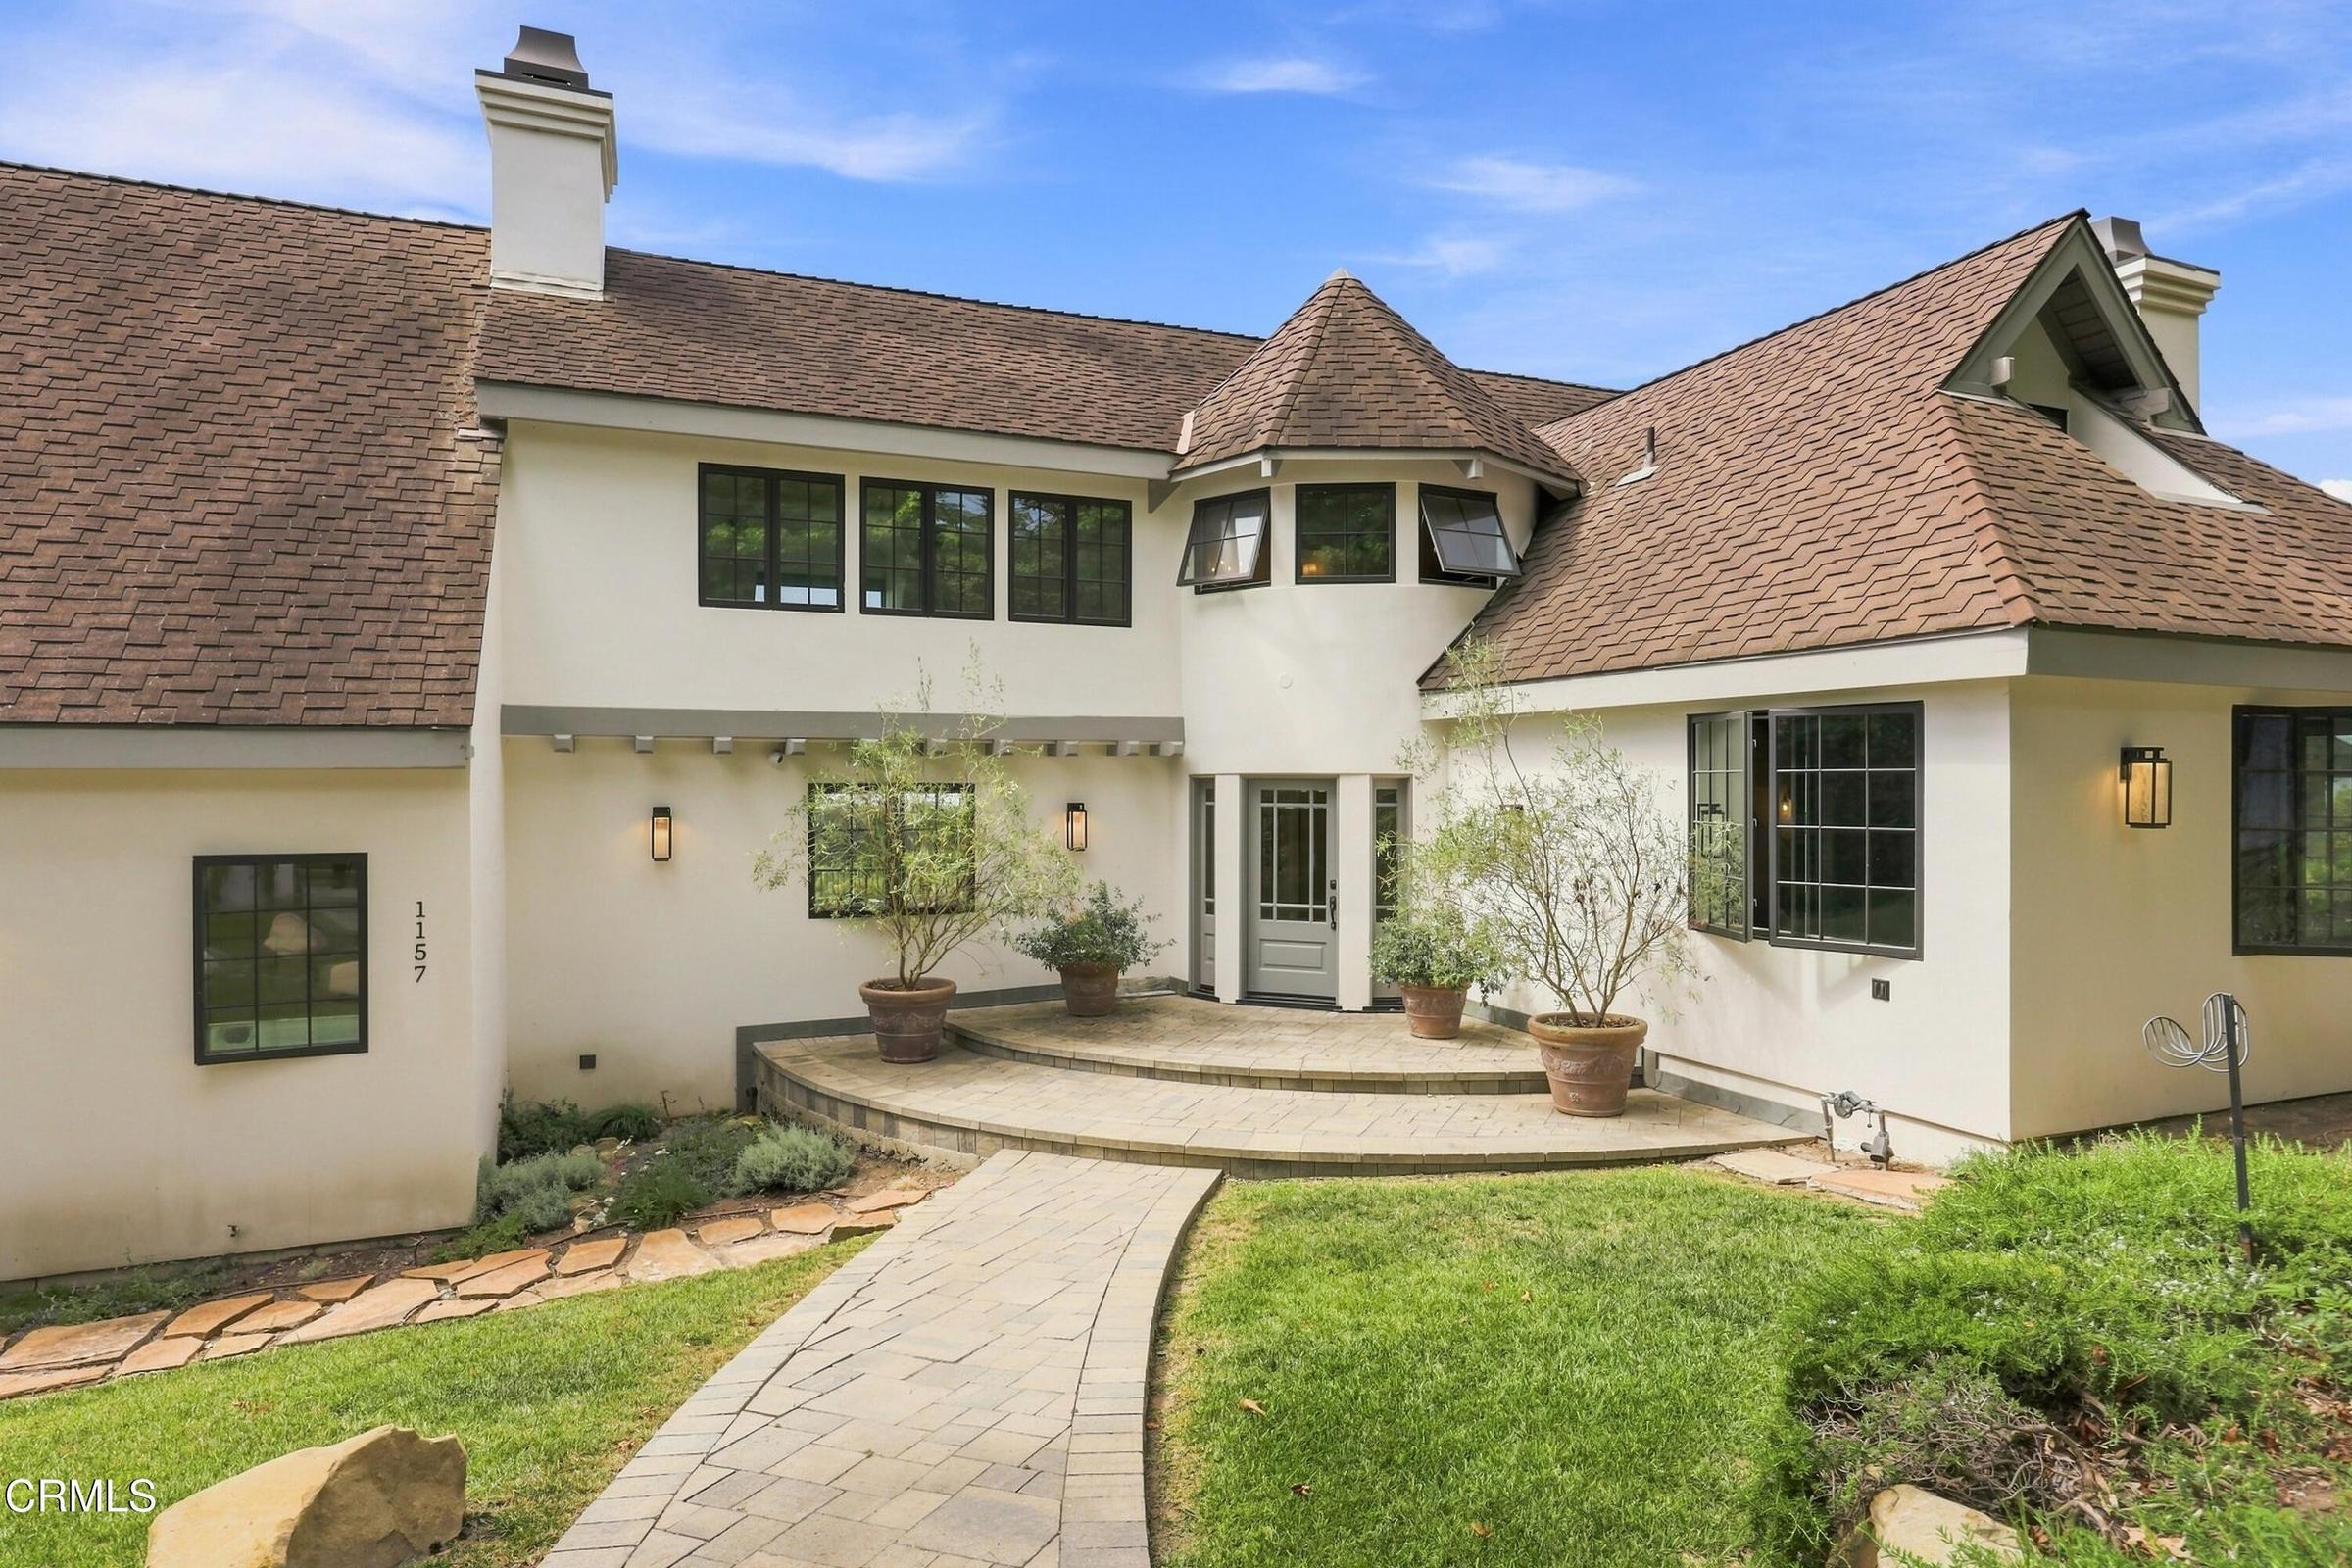
1157 Glenview Road, Montecito, CA 93108
1157 Glenview Road, Montecito, CA 93108
Property Description
Tucked away in Montecito's coveted Pepper Hill neighborhood, this Tudor was remodeled in 2021 and pairs expansive ocean views with a quiet, private setting. Wake up in the primary suite and slide open the oversized glass doors to let in the morning air. Take in the ocean view from the shower, then step into the generous walk-in closet to get ready for coffee and a stroll through the nearby Upper Village. Back at home, accordion doors open the main living area to the outdoors, so evenings can flow from drinks at the full wet bar to dinner al fresco as the sun sets over the ocean and Channel Islands.
Features & Amenities
Property Details
Mortgage Calculator
Current Rates
Comparative Market Analysis
Luxury Tier · 4 active · 5 closed
Montecito · Single Family Residence
Listed 12.2% above the median closed sale of $5,300,000. Price per sqft ($1,423) is a 19% discount to closed comps ($1,757). Luxury tier — fewer comparable sales widen the confidence range.
Price Position
Positioned above the market — commands a premium.
Active Properties (4)
Active Comparables
| Address | City | Year | BD | BTH | SqFt | LotSz | LP/SqFt | LP | DIM | Score |
|---|---|---|---|---|---|---|---|---|---|---|
| 395 Woodley Road | Montecito | 1980 | 4 | 3 | 3,107 | 43,560 | $2,123 | $6.59M | 237 | 70 |
| 605 San Ysidro Road | Santa Barbara | 1920 | 4 | 4 | 3,405 | 45,738 | $1,865 | $6.35M | 44 | 62 |
| 1493 Sycamore Canyon Road | Montecito | 2006 | 5 | 8 | 4,958 | 5,909 | $1,300 | $6.44M | 173 | 35 |
| 2200 Bella Vista Drive | Montecito | 1974 | 3 | 2 | 2,116 | 924,343 | $2,717 | $5.75M | 678 | 22 |
| Total: 4 · Average | 4.0 | 4.3 | 3,396.5 | 254,887.5 | $2,001.25 | $6.28M | 283 | |||
| Median | 3,405 | $6.44M | ||||||||
Closed Properties (5)
Closed Comparables
| Address | City | Year | Date | BD | BTH | SqFt | LotSz | LP | SP | SP/SqFt | SP/LP | DIM | Score |
|---|---|---|---|---|---|---|---|---|---|---|---|---|---|
| 1151 Glenview Road | Montecito | 1981 | 10/28/2026 | 4 | 4 | 3,838 | 37,026 | $6.30M | $5.85M | $1,524 | 0.93 | 95 | 75 |
| 1399 School House Road | Santa Barbara | 1992 | 12/04/2025 | 5 | 5 | 3,637 | 40,511 | $6.95M | $6.63M | $1,822 | 0.95 | 152 | 65 |
| 921 El Rancho Road | Santa Barbara | 1971 | 06/24/2026 | 3 | 3 | 2,234 | 27,878 | $5.39M | $5.20M | $2,325 | 0.96 | 29 | 55 |
| 135 Pomar Lane | Santa Barbara | 1973 | 10/30/2026 | 3 | 3 | 2,360 | 20,473 | $5.50M | $5.30M | $2,246 | 0.96 | 73 | 50 |
| 284 Gould Lane | Santa Barbara | 1989 | 07/07/2026 | 4 | 5 | 6,028 | 73,181 | $5.29M | $5.25M | $870 | 0.99 | 36 | 42 |
| Total: 5 · Average | 3.8 | 4.0 | 3,619.4 | 39,813.8 | $5.64M | $5.64M | $1,757.4 | — | 77 | ||||
| Median | 3,637 | $5.30M | $5.30M | ||||||||||
Market Analysis
List vs Sale $/SqFt
Sale Price Trend
Days on Market
Sale vs List Price
This analysis was generated automatically from MLS data. For an in-depth, human-reviewed valuation, contact Joseph Sardella at josephsardella@gmail.com.