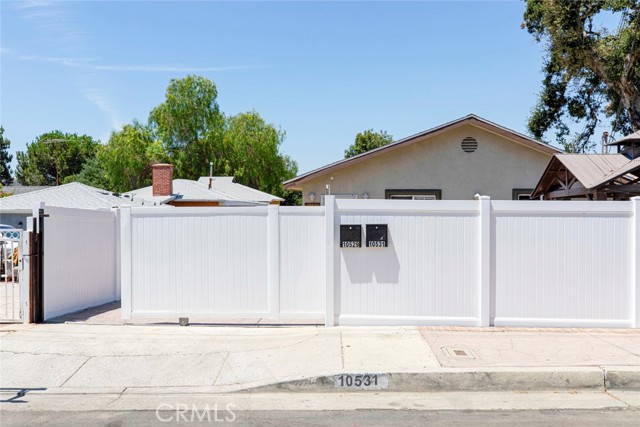
10531 Greenburn Avenue, Sunland, CA 91040
10531 Greenburn Avenue, Sunland, CA 91040
Property Description
Two Homes on One Lot – Exceptional Investment Opportunity! Discover this unique property featuring a 3 bed / 2 bath main house (approx. 1,269 sq. ft.) plus a newer ADU built just 2.5 years ago offering 2 beds / 2 baths (approx. 800 sq. ft.). Each home has its own address and separate utilities, providing maximum flexibility for owner-users and investors. The front home welcomes you with an open and bright floor plan, beautiful wood-style flooring, abundant natural light, and spacious bedrooms. The back ADU is newly built and modern, featuring contemporary finishes, high ceilings, generous windows, and a functional 2 bed / 2 bath layout ideal for rental income or extended family living. Situated on one lot with two fully independent homes, this property is perfect for those looking to live in one and rent the other, or add a strong income-producing asset to their portfolio. Don’t miss this rare opportunity!
Features & Amenities
Property Details
Mortgage Calculator
Current Rates
Comparative Market Analysis
Residential Tier · 5 active · 5 closed
Sunland · Single Family Residence
Listed 7.8% above the median closed sale of $1,113,000.
Price Position
Positioned above the market — commands a premium.
Active Properties (5)
Active Comparables
| Address | City | Year | BD | BTH | SqFt | LotSz | LP/SqFt | LP | DIM | Score |
|---|---|---|---|---|---|---|---|---|---|---|
| 10012 Plainview Avenue | Tujunga | 1925 | 6 | 4 | 2,215 | 6,357 | $554 | $1.23M | 127 | 79 |
| 11123 Odell Avenue | Sunland | 1959 | 4 | 3 | 2,300 | 6,093 | $554 | $1.27M | 61 | 79 |
| 10109 Parr | Sunland | 1949 | 3 | 3 | 2,060 | 6,398 | $581 | $1.20M | 52 | 75 |
| 10945 Mountair | Los Angeles | 1985 | 4 | 3 | 2,156 | 3,884 | $603 | $1.30M | 93 | 73 |
| 10267 Tujunga Canyon Boulevard | Tujunga | 1936 | 3 | 2 | 1,736 | 14,985 | $746 | $1.29M | 45 | 69 |
| Total: 5 · Average | 4.0 | 3.0 | 2,093.4 | 7,543.4 | $607.6 | $1.26M | 75.6 | |||
| Median | 2,156 | $1.27M | ||||||||
Closed Properties (5)
Closed Comparables
| Address | City | Year | Date | BD | BTH | SqFt | LotSz | LP | SP | SP/SqFt | SP/LP | DIM | Score |
|---|---|---|---|---|---|---|---|---|---|---|---|---|---|
| 7961 Apperson Street | Sunland | 1948 | 12/24/2025 | 4 | 4 | 1,801 | 5,925 | $1.10M | $1.11M | $618 | 1.01 | 50 | 83 |
| 10508 Fernglen Avenue | Tujunga | 2008 | 10/21/2026 | 4 | 3 | 2,047 | 4,094 | $1.13M | $1.13M | $553 | 1.01 | 48 | 81 |
| 11021 Quill Avenue | Sunland | 1955 | 09/17/2026 | 4 | 3 | 2,024 | 6,001 | $1.10M | $1.10M | $543 | 1.00 | 55 | 80 |
| 7565 Mcgroarty Street | Tujunga | 1951 | 10/07/2026 | 3 | 3 | 1,854 | 4,583 | $1.20M | $1.20M | $647 | 1.00 | 64 | 79 |
| 10823 Parr | Sunland | 1957 | 06/26/2026 | 3 | 2 | 2,000 | 5,753 | $1.11M | $1.05M | $525 | 0.94 | 49 | 77 |
| Total: 5 · Average | 3.6 | 3.0 | 1,945.2 | 5,271.2 | $1.12M | $1.12M | $577.2 | — | 53.2 | ||||
| Median | 2,000 | $1.11M | $1.11M | ||||||||||
Market Analysis
List vs Sale $/SqFt
Sale Price Trend
Days on Market
Sale vs List Price
This analysis was generated automatically from MLS data. For an in-depth, human-reviewed valuation, contact Joseph Sardella at josephsardella@gmail.com.