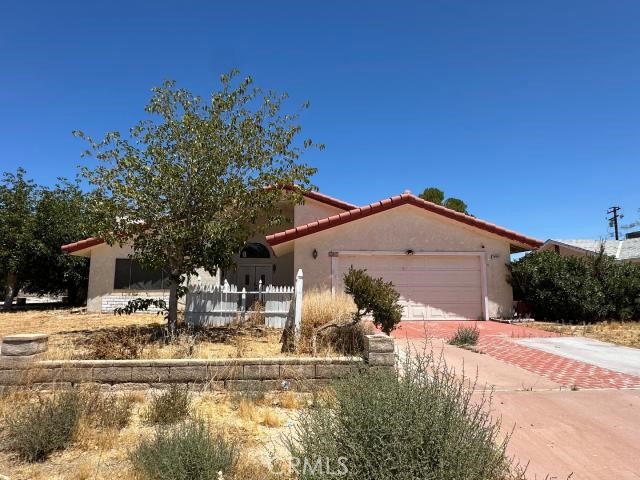
10331 North Loop Boulevard, California City, CA 93505
10331 North Loop Boulevard, California City, CA 93505
Property Description
Corporate-owned home is situated on a spacious 11,240 sq. ft. corner lot. This single-story home offers 1,828 sq. ft. of living space with 3 bedrooms and 2 bathrooms. Step inside and discover a home with so much to offer, including a comfortable living room with a fireplace, a generously sized kitchen with an eating area, and a separate formal dining room. The primary bedroom features a walk-in closet, and the home also includes convenient indoor laundry and an enclosed patio providing additional usable space. The large yard offers plenty of room for entertaining, relaxing, or creating your own outdoor retreat. Conveniently located close to town, this property offers great space inside and out, along with plenty of possibilities for its next owner.
Features & Amenities
Property Details
Mortgage Calculator
Current Rates
Comparative Market Analysis
Affordable Tier · 5 active · 5 closed
California City · Single Family Residence
Listed 4.1% above the median closed sale of $255,500. Expect a longer timeline — comps averaged 159 days on market.
Price Position
Aligned with the market — fair pricing for the comps.
Active Properties (5)
Active Comparables
| Address | City | Year | BD | BTH | SqFt | LotSz | LP/SqFt | LP | DIM | Score |
|---|---|---|---|---|---|---|---|---|---|---|
| 10611 Garibaldi | California City | 1990 | 3 | 2 | 1,500 | 10,495 | $177 | $264,900 | 44 | 85 |
| 21125 Conklin | California City | 1989 | 3 | 2 | 1,422 | 4,361 | $196 | $279,000 | 40 | 82 |
| 21135 Bancroft Court | California City | 1968 | 3 | 2 | 1,677 | 8,706 | $143 | $239,900 | 86 | 81 |
| 21648 95th | California City | 2007 | 3 | 2 | 1,656 | 10,253 | $171 | $282,900 | 65 | 79 |
| 21131 Windsong Street | California City | 1989 | 3 | 3 | 1,591 | 4,600 | $167 | $265,000 | 184 | 77 |
| Total: 5 · Average | 3.0 | 2.2 | 1,569.2 | 7,683 | $170.8 | $266,340 | 83.8 | |||
| Median | 1,591 | $265,000 | ||||||||
Closed Properties (5)
Closed Comparables
| Address | City | Year | Date | BD | BTH | SqFt | LotSz | LP | SP | SP/SqFt | SP/LP | DIM | Score |
|---|---|---|---|---|---|---|---|---|---|---|---|---|---|
| 21640 Garibaldi Ct | California City | 1989 | 10/15/2026 | 3 | 2 | 1,862 | 10,200 | $260,000 | $255,500 | $137 | 0.98 | 83 | 92 |
| 10130 Evelyn | California City | 1988 | 10/16/2026 | 3 | 2 | 1,569 | 11,326 | $279,900 | $270,000 | $172 | 0.96 | 49 | 87 |
| 9840 Margery Avenue | California City | 1990 | 04/28/2026 | 3 | 2 | 1,625 | 10,454 | $275,000 | $275,000 | $169 | 1.00 | 455 | 84 |
| 21265 Windsong | California City | 1989 | 07/29/2026 | 3 | 3 | 1,591 | 4,968 | $228,000 | $234,000 | $147 | 1.03 | 88 | 81 |
| 21020 Pippin | California City | 1987 | 06/23/2026 | 3 | 2 | 1,354 | 8,656 | $240,000 | $230,000 | $170 | 0.96 | 118 | 81 |
| Total: 5 · Average | 3.0 | 2.2 | 1,600.2 | 9,120.8 | $252,900 | $252,900 | $159 | — | 158.6 | ||||
| Median | 1,591 | $255,500 | $255,500 | ||||||||||
Market Analysis
List vs Sale $/SqFt
Sale Price Trend
Days on Market
Sale vs List Price
This analysis was generated automatically from MLS data. For an in-depth, human-reviewed valuation, contact Joseph Sardella at josephsardella@gmail.com.