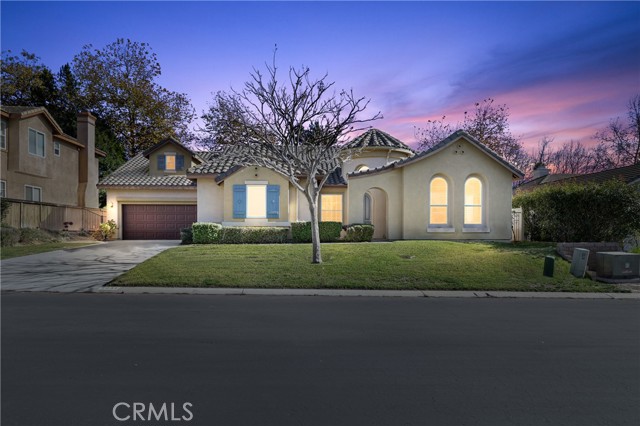
1031 Inverlochy Drive, Fallbrook, CA 92028
1031 Inverlochy Drive, Fallbrook, CA 92028
Property Description
PRICE REDUCTION from a MOTIVATED SELLER for this Single-level living in gated Peppertree Park, backing to a nature preserve with no rear neighbors! This approx. 2,612 sq ft home offers 3 bedrooms, 2.5 baths, and a rare combination of a 2-car garage plus a separate 1-car garage, ideal for a workshop, gym, or extra storage. Move-in-ready updates include luxury vinyl plank flooring in the main living areas, carpet in all bedrooms, plantation shutters throughout, and a fresh neutral palette. The kitchen features a center island and abundant freshly painted cabinetry, with room to add your own countertop and appliance upgrades. It opens to a spacious family room with ceiling fan and direct backyard access, while the formal living and dining rooms offer a separate space to entertain. The oversized primary suite includes a ceiling fan, en-suite bath, and large walk-in closet. Two secondary bedrooms share a full bath, plus a powder room for guests. Outside, enjoy a private, expansive yard with a concrete patio, generous lawn, and peaceful preserve views. HOA includes Peppertree Park's 6-acre amenity area with playground, sport court, nature trails, and BBQ picnic areas. Just 2 miles to Fallbrook's charming downtown village with easy access to the 76 Hwy.
Features & Amenities
Property Details
Mortgage Calculator
Current Rates
About Fallbrook
This property is located in Fallbrook, a community in Fallbrook. Explore more listings in this neighborhood to compare options and pricing.
View Fallbrook ListingsComparative Market Analysis
Residential Tier · 5 active · 5 closed
Fallbrook · Fallbrook · Single Family Residence
Listed 4.8% below the median closed sale of $965,000.
Price Position
Aligned with the market — fair pricing for the comps.
Active Properties (5)
Active Comparables
| Address | City | Year | BD | BTH | SqFt | LotSz | LP/SqFt | LP | DIM | Score |
|---|---|---|---|---|---|---|---|---|---|---|
| 915 Cookie | Fallbrook | 1999 | 3 | 3 | 2,275 | 21,745 | $374 | $850,000 | 20 | 89 |
| 1631 Ranchwood Lane | Fallbrook | 2018 | 4 | 3 | 2,040 | 25,700 | $461 | $939,999 | 16 | 81 |
| 1340 Via Feliz | Fallbrook | 1985 | 3 | 2 | 1,200 | 21,780 | $666 | $799,000 | 32 | 72 |
| 980 Cookie Lane | Fallbrook | 1992 | 5 | 3 | 2,544 | 15,246 | $354 | $899,900 | 52 | 67 |
| 445 Poets Square | Fallbrook | 2003 | 4 | 3 | 2,414 | 4,480 | $356 | $859,000 | 127 | 60 |
| Total: 5 · Average | 3.8 | 2.8 | 2,094.6 | 17,790.2 | $442.2 | $869,579.8 | 49.4 | |||
| Median | 2,275 | $859,000 | ||||||||
Closed Properties (5)
Closed Comparables
| Address | City | Year | Date | BD | BTH | SqFt | LotSz | LP | SP | SP/SqFt | SP/LP | DIM | Score |
|---|---|---|---|---|---|---|---|---|---|---|---|---|---|
| 1691 Pepper Tree | Fallbrook | 1987 | 09/24/2026 | 3 | 2 | 2,048 | 35,284 | $965,000 | $965,000 | $471 | 1.00 | 101 | 81 |
| 1765 Armadale Road | Fallbrook | 1989 | 03/02/2026 | 3 | 2 | 2,027 | 33,977 | $925,000 | $900,000 | $444 | 0.97 | 52 | 79 |
| 1145 Sea Larke Drive | Fallbrook | 1991 | 01/06/2026 | 5 | 4 | 3,136 | 21,780 | $1.17M | $1.05M | $335 | 0.90 | 119 | 76 |
| 1147 Sea Larke Drive | Fallbrook | 1991 | 05/07/2026 | 4 | 3 | 2,426 | 23,522 | $950,000 | $950,000 | $392 | 1.00 | 42 | 68 |
| 1545 Loch Ness Drive | Fallbrook | 2006 | 10/26/2026 | 5 | 5 | 3,612 | 23,522 | $1.10M | $1.05M | $291 | 0.95 | 179 | 65 |
| Total: 5 · Average | 4.0 | 3.2 | 2,649.8 | 27,617 | $983,000 | $983,000 | $386.6 | — | 98.6 | ||||
| Median | 2,426 | $965,000 | $965,000 | ||||||||||
Market Analysis
List vs Sale $/SqFt
Sale Price Trend
Days on Market
Sale vs List Price
This analysis was generated automatically from MLS data. For an in-depth, human-reviewed valuation, contact Joseph Sardella at josephsardella@gmail.com.